Troubleshooting Methods
Client log
For host mount points, JuiceFS Client's log for Linux is by default /var/log/juicefs.log, and C:\Users\<username>\AppData\Local\juicefs.log for Windows. If you encounter any problems when using JuiceFS, check client log first. If no errors are shown, add the --verbose option to the mount command (supports seamless remount) and check DEBUG logs for more.
There are different ways to obtain client log in different environment.
Mount point on host
Use the --log=<log_path> option to specify log location, which defaults to /var/log/juicefs.log or ~/.juicefs/log/juicefs.log depending on which user you use.
Use grep command to focus on specified log levels:
grep 'ERROR\|FATAL' /var/log/juicefs.log
Kubernetes CSI Driver
Depending on the version of the JuiceFS CSI Driver you are using, there will be different ways to obtain logs. For details, refer to CSI Driver documentation.
S3 Gateway
The S3 gateway only supports running in the foreground, so client logs are output directly to the terminal. If you are deploying the S3 gateway in Kubernetes, you need to view the logs for the corresponding pod.
Hadoop Java SDK
Logs of the applications using the JuiceFS Hadoop Java SDK already include JuiceFS client logs, but they are mixed with application logs, you'll need to filter by the juicefs keyword.
File system access log
Different from juicefs.log, the file system access log records every file system access (e.g. open, read, close), which is very helpful when troubleshooting performance issues.
Assuming JuiceFS is mounted to /jfs, run the following commands to collect access log:
cat /jfs/.accesslog

# Collect into a text file
cat /jfs/.accesslog > access.log
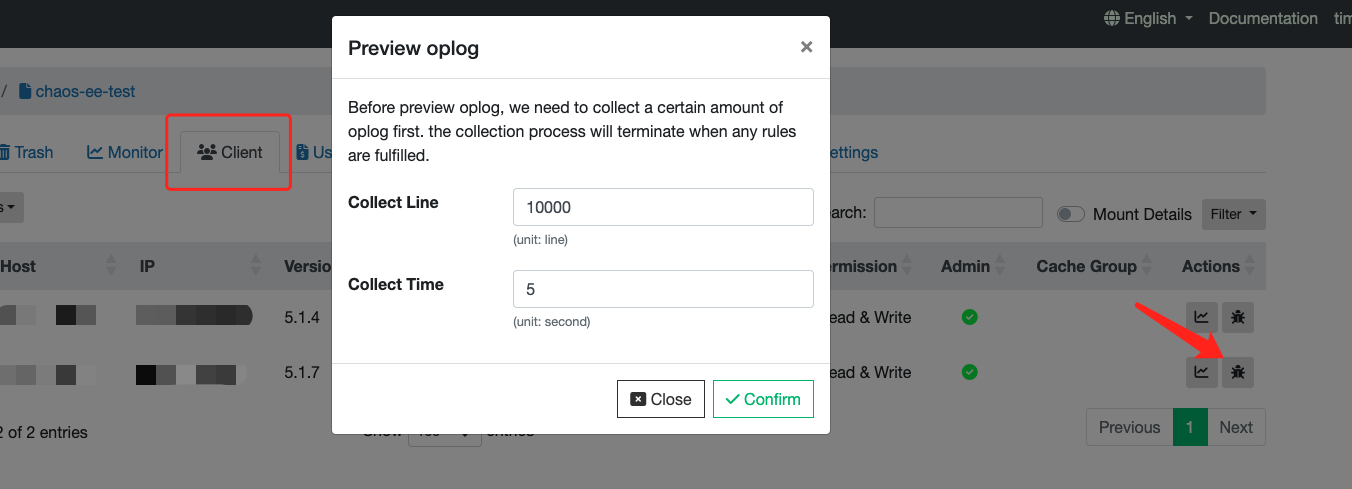
If you cannot easily log into the client environment, you can also download access log directly from our Web Console:
For Kubernetes CSI Driver, you will enter the Mount Pod to run the same commands:
# Find the mount pod for your application pod
# mount pod name contains pvc name by default:
kubectl -n kube-system get pod | grep juicefs | grep [pvc-name]

# You can also list all mount pod and locate by hand:
kubectl -n kube-system get pod -l app.kubernetes.io/name=juicefs-mount

# Print access log inside container:
kubectl -n kube-system exec juicefs-[node]-pvc-d4b8fb4f-2c0b-48e8-a2dc-530799435373 -- cat /jfs/pvc-d4b8fb4f-2c0b-48e8-a2dc-530799435373/.oplog
- All JuiceFS virtual files are sized 0, it's totally expected, just run
catto print its content. .accesslogis also named.oplog, they are the same thing.- If you missed important access log,
cat /jfs/.ophistoryto extract recent logs, file size will not exceed 15M. - For Hadoop SDK, you need to add
juicefs.access-login client configurations of the JuiceFS Hadoop Java SDK to specify the path of the access log, which is disabled by default.
The juicefs profile command performs basic profiling based on this access log, and writes comprehensive statistics to command line output. Use this command to quickly identify the overall file system access pattern of your application, and assess performance.
Log format
Some of the most seen file system operations are listed below, files are always logged as inodes, use juicefs info [INODE] to lookup information on inode.
# Basic format, may vary for different operations:
# [UID,GID,PID] [operation] [arguments (vary for different operations)]: [OK] [debug info] <duration (s)>

# open, arguments (inode, flags)
[uid:0,gid:0,pid:1631098] open (38597810,0x8000): OK (38597810,[-rw-r--r--:0100644,1,0,0,1650446639,1650446639,1650446639,212]) (direct_io:0,keep_cache:1) [handle:00007869] <0.010293>

# read, arguments (inode, size, offset, file-handler)
[uid:0,gid:0,pid:0] read (148199375,69632,1439510528,18333): OK (69632) <0.001047>

# getattr, arguments (inode)
[uid:0,gid:0,pid:1631098] getattr (1): OK (1,[drwxrwxrwx:0040777,19977521,0,0,1634886025,1663052916,1663052916,9265059409920]) <0.000002>

# statfs, arguments (inode)
[uid:0,gid:0,pid:1240206] statfs (1): OK (47474945257472,62476217520128,1165873,4293801422) <0.000345>

# setattr, arguments (inode, setmask, mode)
[uid:0,gid:0,pid:1631098] setattr (45758905,0x1,[mode=-rw-r--r--:00644;]): OK (45758905,[-rw-r--r--:0100644,1,0,0,1664165438,1664165438,1664165438,4096]) <0.011076>

# create, arguments (parent-inode, name, mode, umask)
[uid:0,gid:0,pid:1631098] create (1,.temp.sh.swp,-rw-------:0100600,00000,0x280C2): OK (45758905,[-rw-------:0100600,1,0,0,1664165438,1664165438,1664165438,0]) [handle:00007868] <0.011117>

# write, arguments (inode, size, offset, file-handler)
[uid:0,gid:0,pid:1631098] write (45758905,4096,0,18333): OK <0.000040>

# unlink, arguments (parent-inode, name)
[uid:0,gid:0,pid:1631098] unlink (1,temp.sh~): OK <0.011033>

# flush, arguments (inode, file-handler)
[uid:0,gid:0,pid:1631098] flush (45758905,18333): OK <0.030459>
There are different ways to obtain access log in different environment.
Real-time statistics
JuiceFS provides a plain-text virtual file named .stats at the root of each mount point, reporting real-time statistics, useful for troubleshooting and analysis. These statistics can also be collected through JSON API or Prometheus API. Refer to "Monitoring" for details.
There are different ways to read stats in different environment.
Mount point on host
Assuming JuiceFS is mounted to /jfs:
# View CPU and memory usage:
cat /jfs/.stats | grep usage

# View uptime:
cat /jfs/.stats | grep uptime

# View the count of each object storage operation:
cat /jfs/.stats | grep object

# View object storage data throughput:
cat /jfs/.stats | grep _bytes
Kubernetes CSI Driver
Inside the mount pod, JuiceFS path is /jfs/<pv_volumeHandle>, use these commands to view stats:
# Find the mount pod for your application pod
# mount pod name contains pvc name by default:
kubectl -n kube-system get pod | grep juicefs | grep [pvc-name]

# You can also list all mount pods and locate by hand:
kubectl -n kube-system get pod -l app.kubernetes.io/name=juicefs-mount

# Print access log inside container:
kubectl -n kube-system exec juicefs-[node]-pvc-d4b8fb4f-2c0b-48e8-a2dc-530799435373 -- cat /jfs/pvc-d4b8fb4f-2c0b-48e8-a2dc-530799435373/.stats
Real-Time Performance Monitoring
JuiceFS provides the profile and stats subcommands to visualize real-time performance data, based on the file system access log and Real-time statistics.
juicefs profile
juicefs profile will collect data from file system access log and visualize performance data on all file system operations:
Apart from real-time mode, this command also provides a play-back mode, which performs the same visualization on existing access log files.
To use in real-time:
juicefs profile MOUNTPOINT
A more practical use is to collect access logs in advance, and then re-play using juicefs profile later:
# Collect access logs
cat /jfs/.accesslog > /tmp/op.log

# After performance issue is reproduced, re-play this log file to find system bottleneck
juicefs profile /tmp/op.log
juicefs stats
The juicefs stats command reads JuiceFS Client internal metrics data, and print real-time performance data in a format similar to dstat.
The most basic usage is as follows:
$ juicefs stats /jfs
------usage------ ----------fuse--------- ----meta--- -blockcache remotecache ---object--
 cpu   mem   buf | ops   lat   read write| ops   lat | read write| read write| get   put
 0.0%  124M   32M|   0     0     0     0 |   0     0 |   0     0 |   0     0 |   0     0
From the output, user can tell the data exchange with all external systems, including local cache disk, remote distributed cache, and object storage. This gives a basic view of wether JuiceFS Client is working correctly.
To further increase verbosity, use -l 1 to show latencies as well:
$ juicefs stats -l 1 /jfs
---------usage--------- ----------fuse--------- ----------meta--------- ----blockcache--- ------------------------------remotecache------------------------------ ------------------------object-----------------------
 cpu   mem   buf  cache| ops   lat   read write| ops   lat   send  recv| read write evict| read  rd_c  lat  write  wr_c  lat   db_c  lat   pr_c  lat   wb_c  lat | get  get_c  lat   put  put_c  lat   del  del_c  lat
 0.0%  124M   32M   44M|   0     0     0     0 |   0     0     0     0 |   0     0     0 |   0     0     0     0     0     0     0     0     0     0     0     0 |   0     0     0     0     0     0     0     0     0
Specially, if you need to closely study readahead data waste, change the --schema parameter and add "a" to include readahead related metrics (learn specifics at juicefs stats):
$ juicefs stats -l 1 --schema="ufmcaro" /jfs
---------usage--------- ----------fuse--------- ----------meta--------- ----blockcache--- -------------readahead------------ ------------------------------remotecache------------------------------ ------------------------object-----------------------
 cpu   mem   buf  cache| ops   lat   read write| ops   lat   send  recv| read write evict| used winvl wclup wshrk wfree wclos| read  rd_c  lat  write  wr_c  lat   db_c  lat   pr_c  lat   wb_c  lat | get  get_c  lat   put  put_c  lat   del  del_c  lat
 0.0%  124M   32M   44M|   0     0     0     0 |   0     0     0     0 |   0     0     0 |   0     0     0     0     0     0 |   0     0     0     0     0     0     0     0     0     0     0     0 |   0     0     0     0     0     0     0     0     0
Get runtime information using pprof
By default, JuiceFS clients will listen to a TCP port locally via pprof to get runtime information such as Goroutine stack information, CPU performance statistics, memory allocation statistics. You can view the specific port number that the current JuiceFS client is listening to through the .config file under the mount point:
# Assume the mount point is /jfs
$ cat /jfs/.config | grep 'DebugAgent'
 "DebugAgent": "127.0.0.1:6064",
The default port number range that pprof listens to starts from 6060 and ends at 6099. From the above example, you can see that the actual port number is 6064. Once you get the listening port number, you can view all the available runtime information by accessing http://localhost:<port>/debug/pprof, and some important runtime information will be shown as follows:
- Goroutine stack information:
http://localhost:<port>/debug/pprof/goroutine?debug=1 - CPU performance statistics:
http://localhost:<port>/debug/pprof/profile?seconds=30 - Memory allocation statistics:
http://localhost:<port>/debug/pprof/heap
To make it easier to analyze this runtime information, you can save it locally, e.g.:
curl 'http://localhost:<port>/debug/pprof/goroutine?debug=1' > juicefs.goroutine.txt
curl 'http://localhost:<port>/debug/pprof/profile?seconds=30' > juicefs.cpu.pb.gz
curl 'http://localhost:<port>/debug/pprof/heap' > juicefs.heap.pb.gz
You can also use the juicefs doctor command to automatically collect these runtime information and save it locally. By default, it is saved to the debug directory under the current directory, for example:
juicefs doctor /jfs
For more information about the juicefs doctor command, see command reference.
If you have the go command installed, you can analyze it directly with the go tool pprof command. For example to analyze CPU performance statistics:
$ go tool pprof 'http://localhost:<port>/debug/pprof/profile?seconds=30'
Fetching profile over HTTP from http://localhost:<port>/debug/pprof/profile?seconds=30
Saved profile in /Users/xxx/pprof/pprof.samples.cpu.001.pb.gz
Type: cpu
Time: Dec 17, 2021 at 1:41pm (CST)
Duration: 30.12s, Total samples = 32.06s (106.42%)
Entering interactive mode (type "help" for commands, "o" for options)
(pprof) top
Showing nodes accounting for 30.57s, 95.35% of 32.06s total
Dropped 285 nodes (cum <= 0.16s)
Showing top 10 nodes out of 192
      flat  flat%   sum%        cum   cum%
    14.73s 45.95% 45.95%     14.74s 45.98%  runtime.cgocall
     7.39s 23.05% 69.00%      7.41s 23.11%  syscall.syscall
     2.92s  9.11% 78.10%      2.92s  9.11%  runtime.pthread_cond_wait
     2.35s  7.33% 85.43%      2.35s  7.33%  runtime.pthread_cond_signal
     1.13s  3.52% 88.96%      1.14s  3.56%  runtime.nanotime1
     0.77s  2.40% 91.36%      0.77s  2.40%  syscall.Syscall
     0.49s  1.53% 92.89%      0.49s  1.53%  runtime.memmove
     0.31s  0.97% 93.86%      0.31s  0.97%  runtime.kevent
     0.27s  0.84% 94.70%      0.27s  0.84%  runtime.usleep
     0.21s  0.66% 95.35%      0.21s  0.66%  runtime.madvise
Runtime information can also be exported to visual charts for a more intuitive analysis. The visual charts can be exported to various formats such as HTML, PDF, SVG, PNG, etc. For example, the command to export memory allocation statistics as a PDF file is as follows:
The export to visual chart function relies on Graphviz, so please install it first.
go tool pprof -pdf 'http://localhost:<port>/debug/pprof/heap' > juicefs.heap.pdf
For more information about pprof, please see the official documentation.
JuiceFS Doctor
If all above methods didn't help with your situation, the Juicedata team may ask you to use juicefs doctor to collect abundant debug information, and send the results back to us to continue support.

