Troubleshooting Cases
Debugging process for some frequently encountered JuiceFS problems. Before digging into the actual problems, check your JuiceFS Client version using juicefs version, if too old (e.g. over 6 months), we recommend you to first upgrade to the latest version, to effectively isolates old bugs:
# Use --restart to execute a seamless remount as well
juicefs version --upgrade --restart
Failed to mount JuiceFS / mount hangs
Add --foreground --verbose to the mount command to run JuiceFS Client in foreground, with more debug logs:
juicefs mount $VOL_NAME /jfs --foreground --verbose
Common issues:
-
Incorrect AK/SK will cause failure during creating object storage bucket.
-
DNS resolution failure, i.e. JuiceFS Client cannot resolve metadata server domain name, in this case, confirm that the upstream DNS server is working and flush the local DNS cache.
-
DNS can be correctly resolved, but unable to connect, it is likely that the firewall has restricted port access, making JuiceFS Client unable to connect to the metadata server. Make sure that the host allows outbound traffic to
9300 - 9500TCP port, which is required to communicate with JuiceFS metadata service. Take iptables for example:iptables -A OUTPUT -p tcp --match multiport --dports 9300:9500 -j ACCEPTIf you are using security group of public cloud services, adjust accordingly in their console.
-
On-prem Mount command succeeds, but mount point vanishes shortly after. This is usually caused by a leaked JuiceFS daemon process.
When JuiceFS Client is running, the actual mount point is handled by a Go binary, accompanied by a Python daemon process that's in charge of management and supervising. If you are carrying out a Metadata service migration, and terminate the mount process via special operations (e.g. force unmount), the daemon process may manage to persist, and repeatedly unmount any existing mount point, and try to re-establish connection against a non-existent Metadata address. In this case, use the following commands to cleanup the daemon process:
# Find the PID of the daemon process run by Python
ps -ef | grep juicefs

# Terminate the daemon process using its PID
kill $PID
Read / Write error
There's many possible causes for I/O error, but you can always find useful clues in client logs (default to /var/log/juicefs.log, see mount parameters for details), this section covers some of the more frequently seen problems and troubleshooting steps.
Connection problems with Metadata service
JuiceFS Client needs to maintain TCP connections with Metadata cluster in order provide fast metadata service for the file system, if connection problems occur, logs will be filled with these type of errors:
<ERROR>: request 402 (40) timeout after 1.000603709s
<ERROR>: request 428 (3283870) failed after tried 30 times
The request 402 and request 428 in the above logs are the RPC command codes used by the client to communicate with the metadata service, most of which belong to the metadata operation of the file system. If there are a large number of such RPC request timeout errors in the log, you can use the following command to troubleshoot:
# find Metadata address in established TCP connections
lsof -iTCP -sTCP:ESTABLISHED | grep jfsmount
# if JuiceFS is already unmounted, there'll be no TCP connections, find Metadata master address in config file
grep master ~/.juicefs/$VOL_NAME.conf

# verify access to Metadata service port, assuming Metadata address being aliyun-bj-1.meta.juicefs.com
telnet aliyun-bj-1.meta.juicefs.com 9402
# if telnet is not available, can also use curl / wget
# but Metadata server does not speak in HTTP, it can only respond empty reply
curl aliyun-bj-1.meta.juicefs.com:9402
# curl: (52) Empty reply from server

# if metadata DNS address cannot be resolved, verify that client host can access master_ip
# obtain master_ip in config file
grep master_ip -A 3 ~/.juicefs/$VOL_NAME.conf
# verify access towards master_ip using above telnet or curl commands

# if metadata DNS address can be resolved, verify results match master_ip inside config file
dig aliyun-bj-1.meta.juicefs.com
Above troubleshooting effort usually leads to these problems:
Unable to resolve domain name
In JuiceFS Cloud Service, Metadata domain name are public, domain name resolve failure in client host usually indicates DNS setting issues, try to fix it first.
On the other hand, even if domain name resolve failed, client can work properly as long as it can access Metadata service via IP. That's why with on-premises deployments, JuiceFS metadata service doesn't necessarily need a domain name, as they exist primarily for disaster recovery. If you don't plan to migrate Metadata to another host, it's safe to skip actually setting up domain name resolution for Metadata service, however this will result in some WARNING logs, just ignore them. If you decide to setup domain name resolution, be sure to use correct IPs, clients will run into fatal error if domain name are resolvable, but points to wrong IP addresses.
Connection problems with master_ip
In JuiceFS Cloud Service, client usually connect to Metadata service via public IP, to troubleshoot connection problems with master_ip:
- If
curl,pingfails with timeouts, usually there's problems with security group settings, thoroughly check and avoid firewall issues. - On-prem If probing Metadata service port (default to 9402) results in
Connection Refused, this means client has network access to destination IP, but Metadata Service isn't running. - On-prem Metadata domain name are managed internally, check using above troubleshooting commands to verify if domain name resolution results are the same as
master_ipin config file, if the results don't match, fix domain name resolution or re-mount JuiceFS Client according to the actual situation.
Metadata request timeout
Under normal circumstances, metadata requests won't take up too much traffic. If there's occasional error logs like <ERROR>: request 402 (40) timeout after 1s, possibly accompanied by performance degradations, but without any apparent network problems, or file system access failures, look for clues in the following aspect:
- Check metadata ping latency, if there's latency spikes matching the error logs occurrences, it could be a network instability problem after all;
- Check clients' CPU usage, and compare with actual load and CPU usage on the nodes. For Kubernetes containers, check its resources definition and actual usage on worker nodes, see if there's already overcommitment happening on the nodes. If load is too high on clients, request timeouts can happen due to CPU throttling;
- On-prem Open up the JuiceFS Meta info dashboard in Grafana, check the CPU panel, under normal circumstances,
syscpushould be relatively low (3%-20%), a highsyscputhat's close to 100% indicates metadata service performance issues, which can easily cause client request timeouts. - On-prem If clients access metadata service via private connections like AWS Direct Connect or Azure ExpressRoute, heavy network traffic may impact metadata request performance, causing error messages like
outgoing queue of x.x.x.x:xxx (955107) is full, create a buffer (10240) for it, this means metadata service cannot send data to clients in time, thus puts them in buffers for future retries.
Connection problems with object storage (slow internet speed)
If JuiceFS Client cannot connect to object storage service, or the bandwidth is simply not enough, JuiceFS will complain in logs:
# Upload speed is slow
<INFO>: slow request: PUT chunks/1986/1986377/1986377131_11_4194304 (%!s(<nil>), 20.512s)

# Error uploading to object storage may be accompanied with Golang stacktraces, notice the function names in question and safely assume it's an upload error
<ERROR>: flush 9902558 timeout after waited 8m0s [writedata.go:604]
<ERROR>: pending slice 9902558-80: {chd:0xc0007125c0 off:0 chunkid:1986377183 cleng:12128803 soff:0 slen:12128803 writer:0xc010a92240 freezed:true done:false status:0 notify:0xc010e57d70 started:{wall:13891666526241100901 ext:5140404761832 loc:0x35177c0} lastMod:{wall:13891666526250536970 ext:5140414197911 loc:0x35177c0}} [writedata.go:607]
<WARNING>: All goroutines (718):
goroutine 14275 [running]:
jfs/mount/fs.(*inodewdata).flush(0xc004ec6fc0, {0x7fbc06385918, 0xc00a08c140}, 0x0?)
    /p8s/root/jfs/mount/fs/writedata.go:611 +0x545
jfs/mount/fs.(*inodewdata).Flush(0xc0007ba1e0?, {0x7fbc06385918?, 0xc00a08c140?})
    /p8s/root/jfs/mount/fs/writedata.go:632 +0x25
jfs/mount/vfs.Flush({0x2487e98?, 0xc00a08c140}, 0x9719de, 0x8, 0x488c0e?)
    /p8s/root/jfs/mount/vfs/vfs.go:1099 +0x2c3
jfs/mount/fuse.(*JFS).Flush(0x1901a65?, 0xc0020cc1b0?, 0xc00834e3d8)
    /p8s/root/jfs/mount/fuse/fuse.go:348 +0x8e
...
goroutine 26277 [chan send, 9 minutes]:
jfs/mount/chunk.(*wChunk).asyncUpload(0xc005f5a600, {0x0?, 0x0?}, {0xc00f849f50, 0x28}, 0xc0101e55e0, {0xc010caac80, 0x4d})
    /p8s/root/jfs/mount/chunk/cached_store.go:531 +0x2e5
created by jfs/mount/chunk.(*wChunk).upload.func1
    /p8s/root/jfs/mount/chunk/cached_store.go:615 +0x30c
...
If the problem is a network connection issue - solve the problem and make sure JuiceFS Client can reliably use object storage service. But if the error was caused by low bandwidth, there's some more to consider.
The first issue with slow connection is upload / download timeouts (demonstrated in the above error logs), to tackle this problem:
- Reduce upload concurrency, e.g.
--max-uploads=1, to avoid upload timeouts. - Limit upload traffic, e.g.
--upload-limit=10to set upload traffic to 10Mbps. - Reduce buffer size, e.g.
--buffer-size=64or even lower. In a large bandwidth condition, increasing buffer size improves parallel performance. But in a low speed environment, this only makesflushoperations slow and prone to timeouts. - Default timeout for GET / PUT requests are 60 seconds, increasing
--get-timeoutand--put-timeoutmay help with read / write timeouts.
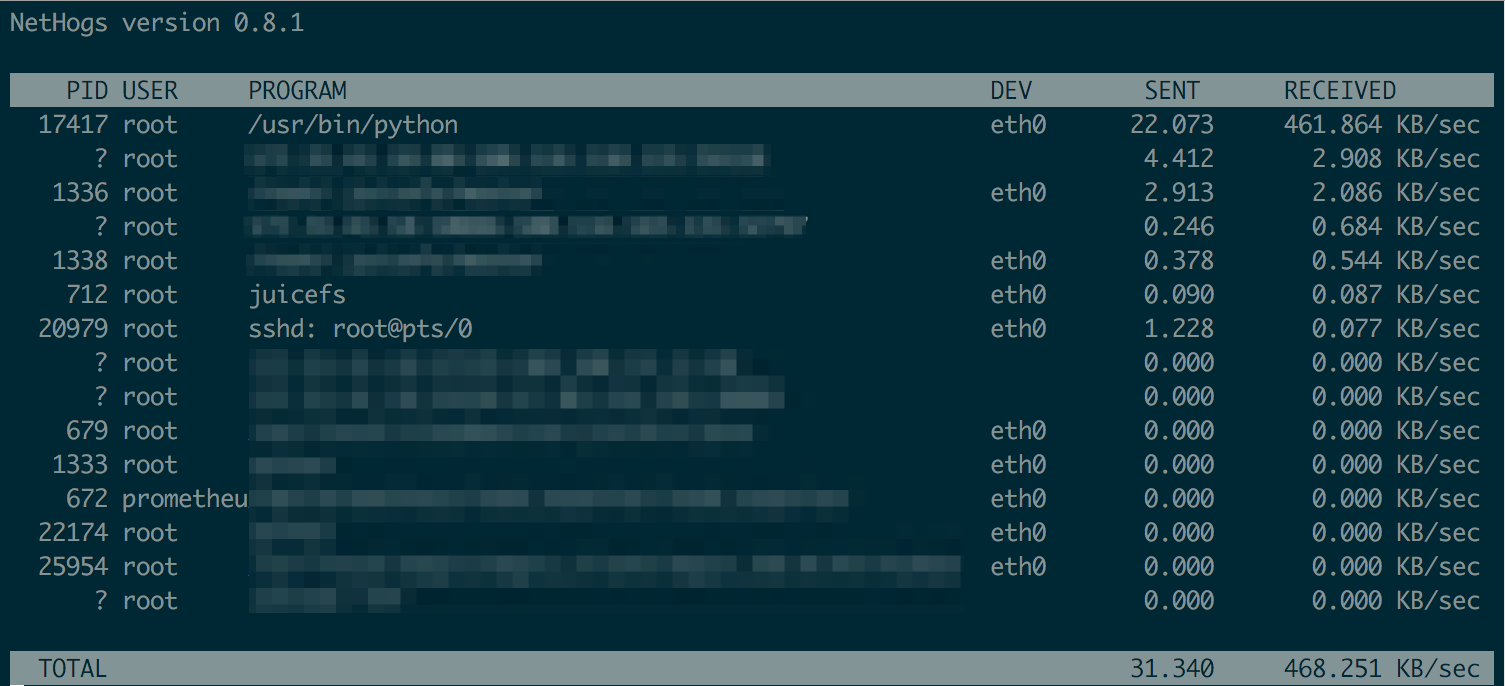
After making relevant adjustments, you can use nethogs to verify network traffic for individual process:
In addition, the "Client Write Cache" feature needs to be used with caution in low bandwidth environment. If the write cache is enabled at the same time in a low bandwidth environment, it's very easy to cause read errors due to compaction failures, with error logs like below.
# while compaction results are slowly being uploaded in low speed clients, read from other clients will hang and eventually fail
<WARNING>: readworker: unexpected data block size (requested: 4194304 / received: 0)
<ERROR>: read for inode 0:14029704 failed after tried 30 times
<ERROR>: read file 14029704: input/output error
<INFO>: slow operation: read (14029704,131072,0): input/output error (0) <74.147891>
<WARNING>: fail to read chunkid 1771585458 (off:4194304, size:4194304, clen: 37746372): get chunks/1771/1771585/1771585458_1_4194304: oss: service returned error: StatusCode=404, ErrorCode=NoSuchKey, ErrorMessage="The specified key does not exist.", RequestId=62E8FB058C0B5C3134CB80B6
<WARNING>: readworker: unexpected data block size (requested: 4194304 / received: 0)
<WARNING>: fail to read chunkid 1771585458 (off:0, size:4194304, clen: 37746372): get chunks/1771/1771585/1771585458_0_4194304: oss: service returned error: StatusCode=404, ErrorCode=NoSuchKey, ErrorMessage="The specified key does not exist.", RequestId=62E8FB05AC30323537AD735D
To avoid this type of read hang, we recommend that you disable background job for low bandwidth clients. You need to create a new "Client Access Token" on the file system "Access Control" page on the console, uncheck "Allow background jobs". Background jobs will not be scheduled when mounting with this token.
WARNING log: block not found in object storage
When using JuiceFS at scale, there will be some warnings in client logs:
<WARNING>: fail to read sliceId 1771585458 (off:4194304, size:4194304, clen: 37746372): get chunks/0/0/1_0_4194304: oss: service returned error: StatusCode=404, ErrorCode=NoSuchKey, ErrorMessage="The specified key does not exist.", RequestId=62E8FB058C0B5C3134CB80B6
When this type of warning occurs, but not accompanied by I/O errors (indicated by input/output error in client logs), you can safely ignore them and continue normal use, client will retry automatically and resolves this issue.
This warning means that JuiceFS Client cannot read a particular slice, because a block does not exist, and object storage has to return a NoSuchKey error. Usually this is caused by:
- Clients by default carry out compaction in background jobs, which upon completion, will change the relationship between file and its corresponding blocks, causing problems for other clients that's already reading this file, hence the warning.
- Some clients enabled "Client Write Cache", they write a file, commit to the Metadata Service, but the corresponding blocks are still pending to upload (caused by for example, slow internet speed). Meanwhile, other clients that are already accessing this file will meet this warning.
Again, if no errors occur, just safely ignore this warning.
Read amplification
In JuiceFS, a typical read amplification manifests as object storage traffic being much larger than JuiceFS Client read speed. For example, JuiceFS Client is reading at 200MiB/s, while S3 traffic grows up to 2GB/s. This is likely caused by readahead and prefetch, read the docs to learn about the design.
When it comes to read amplification, there could be many causes, the most significant factor is the application's read pattern, on the other hand, JuiceFS Client's mount options is very important too:
--buffer-size, a larger buffer allows for greater readahead.--initial-readahead,--max-readahead,--readahead-ratiothese 3 options give readahead finer control, but their use case is actually very limited, if you do face complicated read patterns, please upgrade your JuiceFS Client to 5.1.18 or above, and modify these options under the guidance of a Juicedata engineer.--max-downloadslimits the readahead window indirectly, the max readahead window cannot exceed "Block size * Download concurrency", according to the default parameters, that's4MiB * 200 = 800MiB.
Since 5.1.18, readahead behavior is significantly improved, so before you continue with the content of this section, we advise you to upgrade your JuiceFS Client and see if the unexpected read amplification goes away.
Troubleshoot access pattern
We'll collect JuiceFS access log (see Access log) to determine the file system access patterns of our application, and adjust JuiceFS configuration accordingly. Below is a diagnose process in an actual production environment:
# Collect access log for a period of time, like 30s:
cat /jfs/.oplog | grep -v "^#$" >> op.log

# Simple analysis using wc / grep finds out that most operations are read:
wc -l op.log
grep "read (" op.log | wc -l

# Pick a file and track operation history using its inode (first argument of read):
grep "read (148153116," op.log
Access log looks like:
2022.09.22 08:55:21.013121 [uid:0,gid:0,pid:0] read (148153116,131072,28668010496,19235): OK (131072) <1.309992>
2022.09.22 08:55:21.577944 [uid:0,gid:0,pid:0] read (148153116,131072,14342746112,19235): OK (131072) <1.385073>
2022.09.22 08:55:22.098133 [uid:0,gid:0,pid:0] read (148153116,131072,35781816320,19235): OK (131072) <1.301371>
2022.09.22 08:55:22.883285 [uid:0,gid:0,pid:0] read (148153116,131072,3570397184,19235): OK (131072) <1.305064>
2022.09.22 08:55:23.362654 [uid:0,gid:0,pid:0] read (148153116,131072,100420673536,19235): OK (131072) <1.264290>
2022.09.22 08:55:24.068733 [uid:0,gid:0,pid:0] read (148153116,131072,48602152960,19235): OK (131072) <1.185206>
2022.09.22 08:55:25.351035 [uid:0,gid:0,pid:0] read (148153116,131072,60529270784,19235): OK (131072) <1.282066>
2022.09.22 08:55:26.631518 [uid:0,gid:0,pid:0] read (148153116,131072,4255297536,19235): OK (131072) <1.280236>
2022.09.22 08:55:27.724882 [uid:0,gid:0,pid:0] read (148153116,131072,715698176,19235): OK (131072) <1.093108>
2022.09.22 08:55:31.049944 [uid:0,gid:0,pid:0] read (148153116,131072,8233349120,19233): OK (131072) <1.020763>
2022.09.22 08:55:32.055613 [uid:0,gid:0,pid:0] read (148153116,131072,119523176448,19233): OK (131072) <1.005430>
2022.09.22 08:55:32.056935 [uid:0,gid:0,pid:0] read (148153116,131072,44287774720,19233): OK (131072) <0.001099>
2022.09.22 08:55:33.045164 [uid:0,gid:0,pid:0] read (148153116,131072,1323794432,19233): OK (131072) <0.988074>
2022.09.22 08:55:36.502687 [uid:0,gid:0,pid:0] read (148153116,131072,47760637952,19235): OK (131072) <1.184290>
2022.09.22 08:55:38.525879 [uid:0,gid:0,pid:0] read (148153116,131072,53434183680,19203): OK (131072) <0.096732>
Studying the access log, it's easy to conclude that our application performs frequent random small reads on a very large file, notice how the offset (the third argument of read) jumps significantly between each read, this means consecutive reads are accessing very different parts of the large file, thus prefetched data blocks is not being effectively utilized (a block is 4MiB by default, an offset of 4194304 bytes), only causing read amplifications. In this situation, we can safely set --prefetch to 0, so that prefetch concurrency is zero, which is essentially disabled. Re-mount and our problem is solved.
Troubleshoot via juicefs stats
Since 5.2, you can use append a in --schema to print detailed readahead metrics, to determine if there's wasted data in the readahead process.
$ juicefs stats /jfsno -l 1 --schema="ao"
-------------readahead------------ ------------------------object-----------------------
 used winvl wclup wshrk wfree wclos| get  get_c  lat   put  put_c  lat   del  del_c  lat
   0     0     0     0     0     0 |   0     0     0     0     0     0     0     0     0
Every column in the readahead section stands for a specific type of waste, refer to juicefs stats for explanation.
Write amplification
Write operation by itself does not create amplification in JuiceFS, the object storage upload traffic will be roughly equal to the written data, thanks to JuiceFS' storage format.

As shown above, write amplification primarily comes from compaction. Different write pattern produces very different levels of file fragmentation:
-
With ample upload bandwidth, sequential write will produce full sized blocks (default to 4M), no fragmentation at all.
-
When faced with limited upload bandwidth, big file sequential write can become fragmented as well.
By default, JuiceFS flushes data from buffer to object storage every 5 seconds, if bandwidth is not sufficient, these frequent
fsyncoperations will form a large number of consecutive small files under block size (default to 4M), i.e. file fragments.To optimize read performance for this type of data, JuiceFS will perform compaction, during which the small fragments will be merged and re-uploaded to the object storage. The bandwidth consumed will in return will worsen the write amplification.
-
For frequent small append writes (every write accompanied by
fsync, which uploads to object storage) or random writes, fragmentation and the consequent compaction is inevitable.
To conclude, write amplification under small append writes / random writes is inevitable, which is also the necessary trade-off for the best read / write performance. But for sequential writes under limited bandwidth, fragmentation is optimizable:
- When sequentially writing large files, no compaction is expected, open up the file system monitor page and check object storage traffic.
- If there's obvious compaction traffic, you may be faced with fragmentation caused by slow write speed.
- Locate the JuiceFS clients that's writing, adjust the mount options to
--flush-wait=60as this will change the default flush delay from 5 seconds to 60 seconds. The prolonged delay will prevent fragmentation.
Distributed cache / Dedicated cache cluster issues
Read distributed cache.
High resource usage
If JuiceFS Client is taking up too much resources, we recommend adjusting mount options to actively reduce resource usage, rather than setting a hard limit on the JuiceFS Client, including:
- Run JuiceFS Client using systemd.service
- Run JuiceFS Client in container (including using JuiceFS CSI Driver, but that's another topic, see CSI Driver resource optimization)
File system is after all, an infrastructure, setting a hard limit on resources will result in a poor user experience:
- Setting limits on CPU will cause CPU throttle for JuiceFS Client, file system access will slow down and can even stuck.
- Setting limits on memory can cause OOM (Out of Memory) kill and mount point will be lost, even if JuiceFS Client auto restarts on failure, application may not necessarily handle this properly, for example when using JuiceFS via
hostPath, a mount point crash can only be fixed by restarting the application container. - Setting limits on network bandwidth can cause timeout when downloading data from object storage, resulting in I/O errors, this situation is covered in Connection problems with object storage.
So if JuiceFS Client is indeed using too much resources, try to optimize using the methods introduced here, and keep in mind that resource optimizations aren't free, and will affect performance, but still, active optimization often brings a smoother experience comparing to setting hard limits.
The amount of resource used by JuiceFS clients really depends on the required performance level, and can be optimized towards preference over either performance or resource usage.
JuiceFS Client is built for high-performance scenarios, and is not recommended for low-resource usage. Below examples are only provided as a guideline, not a guarantee that resource usage will be lower than your desired threshold.
If you must use a network file system with very limited resource, please use NFS or other alternatives.
Prefer low resource usage
If you have no demands for performance and only wish for low resource usage, try below settings.
juicefs mount myjfs /jfs \
  --cache-size=0 \
  --buffer-size=32 \
  --max-cached-inodes=10000 \
  --max-uploads=5 \
  --max-downloads=5
Explanations on above options:
--cache-size=0disable local disk cache (often used with distributed caching), but note that this causes JuiceFS Client to try to allocate an additional memory space of 100MB to use as cache. To avoid this memory overhead, use--cache-size=1024instead (1GB of local disk cache).--buffer-size=32sets read/write buffer to 32MB. Such a small buffer heavily limits client performance, and note that buffer is just a part of memory overhead, there are other costs like metadata cache.--max-uploads=5and--max-downloads=5manually limit I/O concurrency against object storage. As a matter of fact, buffer size indirectly limits concurrency as well, the 32MB buffer in the above example already puts a low limit on overall concurrency. But to provide an example for the worst case, we'll manually limit concurrency to 5.--max-cached-inodes=10000significantly lower the allowed number of inode cache, which by default is 5 million. This part of resource can be saved for a lower memory usage.
Balance performance and resource usage
A balance between overhead and performance is actually the most common pursuit when running JuiceFS, and there's such a wide variety of tuning possibilities, that we simply can't provide a set of parameters that'll suit your scenario. Instead, we'll provide a list of parameters that's crucial to performance tuning:
- Use a
--buffer-sizeof 500 to 1024, that's 500MB to 1GB of read/write buffer, which is sufficient for most real world scenarios. Usejuicefs statsto verify actual usage and continue tuning further on. From our experience, a client with moderately sized buffer (500MB~1GB) takes up a total memory amount that's 4x times the buffer size. - Adjust
--cache-sizeand--free-space-ratioaccording to actual environment. --max-uploadsdefaults to 20, which is more than enough for your average sequential write scenarios. Since the default block size is 4M, a max concurrency of 20 can already handle very large upload traffic, further increasing this value may result in larger client resource usage, or even stress out your object storage service. So usually this only needs adjustment when faced with intensive random write scenarios.--max-downloadsdefaults to 200, generally needs no adjustment due to the same reason as--max-uploads.- To actively limit I/O traffic, or CPU usage, use a lower
--upload-limitand--download-limitto limit upload/download speed. - JuiceFS Client is a Go program, so you can set a lower
GOGC(defaults to 100) to let it garbage collect more aggressively. This for sure consumes more CPU and may impact performance. Read Go Runtime for more. - On-prem If you use self-hosted Ceph RADOS as the data storage of JuiceFS, consider replacing glibc with TCMalloc, the latter comes with more efficient memory management and may decrease off-heap memory footprint in this scenario.
As explained above, --buffer-size is the most important consideration in both high and low resource scenarios. With a smaller buffer, concurrency and traffic will naturally reduce and there's no need to explicitly adjust max-uploads|upload-limit|max-downloads|download-limit.
Unmount error
If a file or directory are opened when you unmount JuiceFS, you'll see below errors, assuming JuiceFS is mounted on /jfs:
# Linux
umount: /jfs: target is busy.
        (In some cases useful info about processes that use
         the device is found by lsof(8) or fuser(1))

# macOS
Resource busy -- try 'diskutil unmount'

# With Kubernetes cluster, umount failure will usually cause mount pod to stuck at Terminating state
# Meanwhile, kubelet will produce the following error
Failed to remove cgroup (will retry)" error="rmdir /sys/fs/cgroup/blkio/kubepods/burstable/podxxx/xxx: device or resource busy
If you just want to unmount ASAP, and do not care what happens to opened files, run juicefs umount --force to forcibly umount, note that behavior is different between Linux and macOS:
-
For Linux,
juicefs umount --forceis translated toumount --lazy, file system will be detached, but opened files remain, FUSE client will exit when file descriptors are released. That's why JuiceFS Client process may linger even after mount point is gone. To forcibly quit all JuiceFS Client processes, run this command:ps -ef | grep -P '(/juicefs |juicefs -mountpoint|mount.juicefs|jfsmount)' | grep -v grep | awk '{print $2}' | xargs kill -9 -
For macOS,
juicefs umount --forceis translated toumount -f, file system will be forcibly unmounted and opened files will be closed immediately. The commanddiskutil unmount forcedoes the same thing.
If you need to troubleshoot whatever process that's accessing JuiceFS, causing failure to umount, you can locate the files being opened using commands like lsof /jfs, deal with these processes (like force quit), and retry.
If all above methods failed, use command like ps -eo pid,ppid,stat,command | grep ' D ' to check if there is a D state (Uninterruptible Sleep) process related to JuiceFS (such as a process that is accessing a JuiceFS mount point). If it exists, you need to forcibly close the FUSE connection with the following steps:
# If JuiceFS is the only FUSE mount point in the system, /sys/fs/fuse/connections will contain only one directory. In this case, no further checks are needed.
echo 1 > /sys/fs/fuse/connections/[device-number]/abort

# If there are multiple FUSE mount points in the system, use the following commands to check their respective number of stuck FUSE requests and find out the stuck connection.
tail -n +1 /sys/fs/fuse/connections/*/waiting

# If multiple mount points return values greater than 0, continue polling to find out the stuck connections with values above 0 and abort them.
watch -n 3 'tail -n +1 /sys/fs/fuse/connections/*/waiting'
After FUSE connection is closed, the corresponding mount point is no longer stuck, retry umount and then mount again to continue using.
THP memory defragmentation freezes system
In production environment, a large memory node often hosts complex applications, which can cause memory fragmentation after running for a long time. When application tries to allocate transparent hugepage (THP), Kernel tries to compact memory into hugepage and this can freeze the system, leading to serious performance degradation. JuiceFS is susceptible to this problem as well, and can produce the following symptoms when it happens:
-
Network failures and timeouts that have no apparent causes, Metadata requests keeps retrying and object storage requests slow down as well, some relevant logs:
# Metadata network errors
read header: read tcp 10.75.x.x:34258->10.74.x.x:9445: read: connection reset by peer [client.go:1298]
reconnect meta: read tcp 10.75.x.x:45444->10.74.x.x:9445: read: connection reset by peer, len=0 [client.go:975]
connect 10.74.x.x:9445: dial tcp 10.74.x.x:9445: connect: connection refused [client.go:453]
connected to meta 10.74.x.x:9445 after 211.232484ms [client.go:916]
read header: EOF [client.go:1298]
can't find request for packet 605226 (cmd: 429, size: 63733) [client.go:1328]
request 428 (604439) is timeout after 16m0.579282038s, restart it [client.go:667]

# Object storage network errors
slow request: GET chunks/0D/15/xxxxxxxx_4_4194304 RANGE(0,-1) (req_id: "", err: <nil>, cost: 3m40.315940825s) [cached_store.go:260]
fail to read chunkid xxxxxxxx (off:16777216, size:4194304, clen: 67108864): timeout after 1m0s: function timeout [data.go:469]
readworker: unexpected data block size (requested: 4194304 / received: 0) [readdata.go:319]
upload chunks/04/2481/xxxxxxxxxx_0_xxxxx: Put "http://xx.aliyuncs.com/ali%2Fchunks%2F04%2F2481%2Fxxxxxxxxxx_0_xxxxx": read tcp x.x.x.x:60184->x.x.x.x:80: read: connection reset by peer (try 1) [cached_store.go:674] -
Mount point freezes completely, commands like
df -h,lsget stuck, even other common system commands likelsofandpscould get stuck. -
Lots of FUSE requests never return and keeps waiting, use the command introduced in earlier section
tail -n +1 /sys/fs/fuse/connections/*/waitingto observe.
Looking at the symptoms, performance issue caused by memory defragmentation can often be treated as more complex low-level network problems, which is difficult to troubleshoot and solve, that's why we recommend that you immediately adjust THP related system settings, before moving on to more troubleshooting efforts.
# Set min_free_kbytes to 1% of total memory, so that Kernel starts defragmentation earlier
# e.g. for nodes with 1TB memory, use a value of 10G
sysctl -w vm.min_free_kbytes=10485760
# Change defrag policy to defer so that when Kernel cannot allocate THP,
# it uses 4KB pages instead and starts background defragmentation,
# which avoids blocking application I/O
echo defer > /sys/kernel/mm/transparent_hugepage/defrag
Since JuiceFS 5.2, client automatically adjust to the defer policy (the second command in the above code snippet), to avoid THP defragmentation issues, but you should still note that under Kubernetes scenarios, a Mount Pod cannot directly modify system parameters, so that you need to enable tuneTransparentHugePage in your cluster settings in order effect the host.
Read THP-related performance optimization in Alibaba Cloud Linux for more.