监控 JuiceFS CSI Driver
JuiceFS CSI Driver 通过 Prometheus 暴露内部状态和一些指标,以便进行监控和告警。
如何暴露和抓取 Metrics
JuiceFS CSI Driver 的 Controller 和 Node 服务都暴露了一个 /metrics HTTP 端点,默认端口为 9567, 可以通过 helm values 更改
node:
  metricsPort: "9567"
controller:
  metricsPort: "9567"
配置 Prometheus 抓取
启用 metrics 端点后,你需要配置 Prometheus 来抓取这��些指标。这通常通过创建一个 ServiceMonitor 或 PodMonitor CRD (如果你的集群中安装了 Prometheus Operator) 来实现,或者直接在 Prometheus 配置文件中添加抓取任务。
以下是一个使用 PodMonitor 的例子:
# csi-podmonitor.yaml
apiVersion: monitoring.coreos.com/v1
kind: PodMonitor
metadata:
  name: juicefs-csi
  namespace: kube-system
  labels:
    app: juicefs-csi
spec:
  selector:
    matchLabels:
      app.kubernetes.io/name: juicefs-csi-driver
  podMetricsEndpoints:
  - port: metrics
    interval: 15s
如果没有安装 Prometheus Operator,可以直接修改 Prometheus 的抓取配置:
此示范假定 Prometheus 服务运行在 Kubernetes 集群中,如果运行在集群外,请参考 收集监控指标 进行配置。
# prometheus-scrape-config.yaml
  - job_name: 'csi'
    kubernetes_sd_configs:
      - role: pod
    relabel_configs:
      - source_labels: [__meta_kubernetes_pod_phase]
        separator: ;
        regex: (Failed|Succeeded)
        replacement: $1
        action: drop
      - source_labels: [__meta_kubernetes_pod_label_app_kubernetes_io_name, __meta_kubernetes_pod_labelpresent_app_kubernetes_io_name]
        separator: ;
        regex: (juicefs-csi-driver);true
        replacement: $1
        action: keep
      - source_labels: [__meta_kubernetes_pod_container_port_name]
        separator: ;
        regex: metrics
        replacement: $1
        action: keep
      - separator: ;
        regex: (.*)
        target_label: endpoint
        replacement: metrics
        action: replace
      - source_labels: [__address__]
        separator: ;
        regex: (.*)
        modulus: 1
        target_label: __tmp_hash
        replacement: $1
        action: hashmod
      - source_labels: [__tmp_hash]
        separator: ;
        regex: "0"
        replacement: $1
        action: keep
将以上 YAML 文件应用到你的集群后,Prometheus 就会自动开始抓取 JuiceFS CSI Driver 的指标。
指标含义
JuiceFS CSI Driver 暴露的指标主要用于追踪 CSI 操作的错误计数。
Controller Metrics
这些指标由 juicefs-csi-controller Pod 暴露。
| 指标名称 | 类型 | 描述 |
|---|---|---|
juicefs_provision_errors | Counter | 卷创建 (Provision) 失败的总次数。 |
juicefs_provision_errors: 这是一个计数器,记录了 CSIProvision操作失败的次数。如果这个值持续增长,说明存储卷的动态创建过程存在问题。可能的原因包括:- JuiceFS 文件系统授权失败。
- 访问对象存储或元数据引擎出现网络问题。
Node Metrics
这些指标由 juicefs-csi-node DaemonSet 的 Pod 暴露。
| 指标名称 | 类型 | 描述 |
|---|---|---|
juicefs_volume_errors | Counter | 卷挂载 (Volume Mount) 失败的总次数。 |
juicefs_volume_del_errors | Counter | 卷卸载 (Volume Unmount) 失败的总次数。 |
juicefs_volume_path_health | Gauge | 卷路径的健康状态,1 表示健康,0 表示不健康。 |
-
juicefs_volume_errors: 这是一个计数器,记录了将 JuiceFS 卷挂载到节点上时发生错误的次数。这对应于 CSI 的NodePublishVolume操作。如果这个值持续增长,可能表示:- 节点上的 JuiceFS 客户端无法正常启动。
- 挂载点目录创建失败或权限不正确。
- 从 Secret 中获取的 JuiceFS 认证信息有误。
- bind 失败。
-
volume_del_errors: 这是一个计数器,记录了从节点上卸载 JuiceFS 卷时发生错误的次数。这对应于 CSI 的NodeUnpublishVolume操作。如果这个值持续增长,可能表示:- 卸载操作被阻塞(例如,卷仍在使用中)。
- 挂载点信息丢失或不一致。
-
juicefs_volume_path_health: 这是一个 Gauge 类型的指标,用于表示卷路径的健康状态。标签包括volume_id,volume_path, 和pod_uid(业务 Pod UID)。当卷路径健康时,值为 1;如果检测到问题,值为 0,表示该卷路径不健康。可能表示:- 挂载点丢失。
- mountpod 运行中,但挂载点处于异常状态。
- 访问超时。
除了以上自定义指标,Prometheus 还会抓取标准的 Go 进程指标 (如 go_goroutines, go_memstats_* 等) 和进程指标 (如 process_cpu_seconds_total, process_resident_memory_bytes 等)。
Dashboard 示例
下面是一个 JuiceFS CSI Driver 监控 Dashboard 示例:
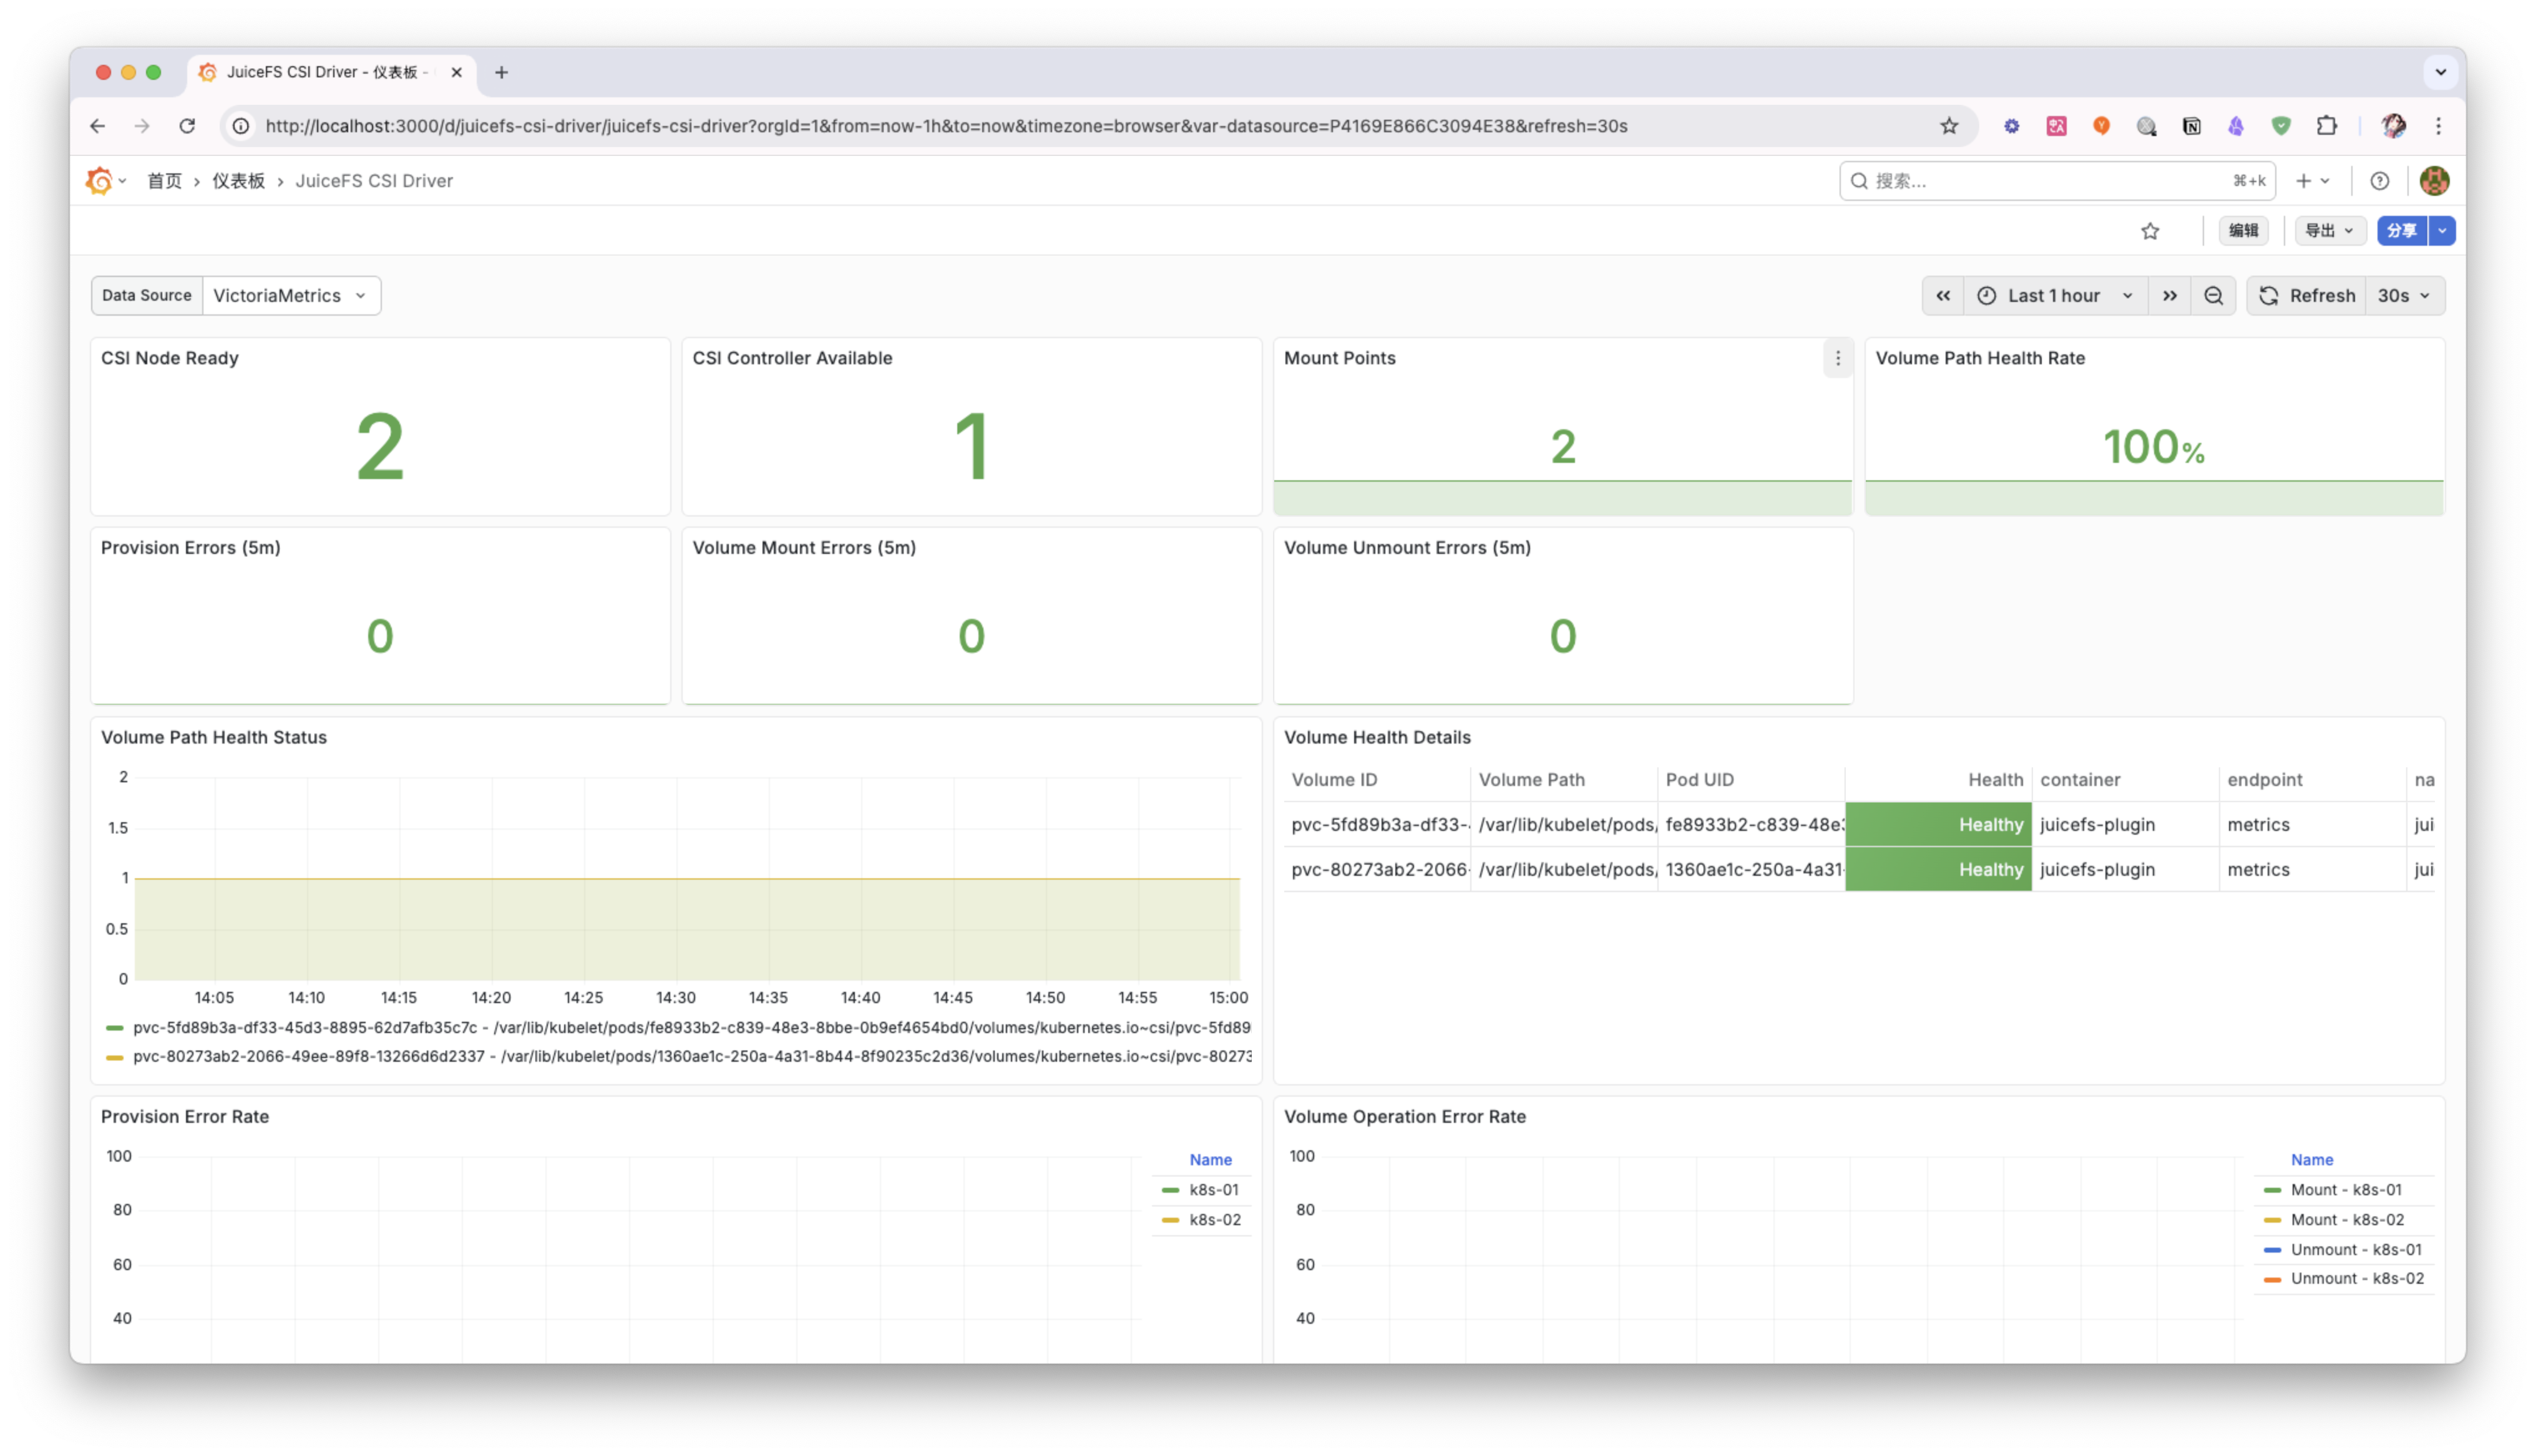
你可以根据自己的需求,调整和扩展这个 Dashboard,以更好地监控 JuiceFS CSI Driver 的运行状态。