Monitoring JuiceFS CSI Driver
JuiceFS CSI Driver exposes internal state and metrics through Prometheus for monitoring and alerting.
How to Expose and Scrape Metrics
Both the Controller and Node services of JuiceFS CSI Driver expose a /metrics HTTP endpoint. The default port is 9567, which can be changed through helm values:
node:
  metricsPort: "9567"
controller:
  metricsPort: "9567"
Configure Prometheus Scraping
After enabling the metrics endpoint, you need to configure Prometheus to scrape these metrics. This is typically done by creating a ServiceMonitor or PodMonitor CRD (if Prometheus Operator is installed in your cluster), or by adding scrape jobs directly to the Prometheus configuration file.
Here's an example using PodMonitor:
# csi-podmonitor.yaml
apiVersion: monitoring.coreos.com/v1
kind: PodMonitor
metadata:
  name: juicefs-csi
  namespace: juicefs
  labels:
    app: juicefs-csi
spec:
  selector:
    matchLabels:
      app.kubernetes.io/name: juicefs-csi-driver
  podMetricsEndpoints:
  - port: metrics
    interval: 15s
If Prometheus Operator is not installed, you can directly modify Prometheus' scraping configuration:
This example assumes that the Prometheus service is running in a Kubernetes cluster. If it is running outside the cluster, please refer to Collecting Monitoring Metrics for configuration.
# prometheus-scrape-config.yaml
  - job_name: 'csi'
    kubernetes_sd_configs:
      - role: pod
    relabel_configs:
      - source_labels: [__meta_kubernetes_pod_phase]
        separator: ;
        regex: (Failed|Succeeded)
        replacement: $1
        action: drop
      - source_labels: [__meta_kubernetes_pod_label_app_kubernetes_io_name, __meta_kubernetes_pod_labelpresent_app_kubernetes_io_name]
        separator: ;
        regex: (juicefs-csi-driver);true
        replacement: $1
        action: keep
      - source_labels: [__meta_kubernetes_pod_container_port_name]
        separator: ;
        regex: metrics
        replacement: $1
        action: keep
      - separator: ;
        regex: (.*)
        target_label: endpoint
        replacement: metrics
        action: replace
      - source_labels: [__address__]
        separator: ;
        regex: (.*)
        modulus: 1
        target_label: __tmp_hash
        replacement: $1
        action: hashmod
      - source_labels: [__tmp_hash]
        separator: ;
        regex: "0"
        replacement: $1
        action: keep
After applying the above YAML file to your cluster, Prometheus will automatically start scraping metrics from JuiceFS CSI Driver.
Metrics Description
The metrics exposed by JuiceFS CSI Driver are primarily used to track error counts of CSI operations.
Controller Metrics
These metrics are exposed by the juicefs-csi-controller Pod.
| Metric Name | Type | Description |
|---|---|---|
juicefs_provision_errors | Counter | Total number of volume provision failures. |
juicefs_provision_errors: This is a counter that records the number of failed CSIProvisionoperations. If this value continues to grow, it indicates issues with the dynamic volume creation process. Possible causes include:- JuiceFS filesystem authorization failure.
- Network issues accessing object storage or metadata engine.
Node Metrics
These metrics are exposed by the juicefs-csi-node DaemonSet Pods.
| Metric Name | Type | Description |
|---|---|---|
juicefs_volume_errors | Counter | Total number of volume mount failures. |
juicefs_volume_del_errors | Counter | Total number of volume unmount failures. |
juicefs_volume_path_health | Gauge | Health status of the volume path, 1 for healthy, 0 for unhealthy. |
-
juicefs_volume_errors: This is a counter that records the number of errors that occurred when mounting JuiceFS volumes to nodes. This corresponds to CSI'sNodePublishVolumeoperations. If this value continues to grow, it may indicate:- JuiceFS client on the node cannot start normally.
- Mount point directory creation failed or incorrect permissions.
- Invalid JuiceFS authentication information retrieved from Secret.
- Bind mount failure.
-
juicefs_volume_del_errors: This is a counter that records the number of errors that occurred when unmounting JuiceFS volumes from nodes. This corresponds to CSI'sNodeUnpublishVolumeoperations. If this value continues to grow, it may indicate:- Unmount operation is blocked (e.g., volume still in use).
- Mount point information is missing or inconsistent.
-
juicefs_volume_path_health: This is a Gauge type metric used to indicate the health status of the volume path. Labels includevolume_id,volume_path, andpod_uid(the business Pod UID). When the volume path is healthy, the value is 1; if a problem is detected, the value is 0, indicating that the volume path is unhealthy. Possible indications include:- Missing mount point.
- mountpod is running, but the mount point is in an abnormal state.
- Access timeout.
In addition to the above custom metrics, Prometheus will also scrape standard Go process metrics (such as go_goroutines, go_memstats_*, etc.) and process metrics (such as process_cpu_seconds_total, process_resident_memory_bytes, etc.).
Dashboard example
Below is an example of a JuiceFS CSI Driver monitoring Dashboard:
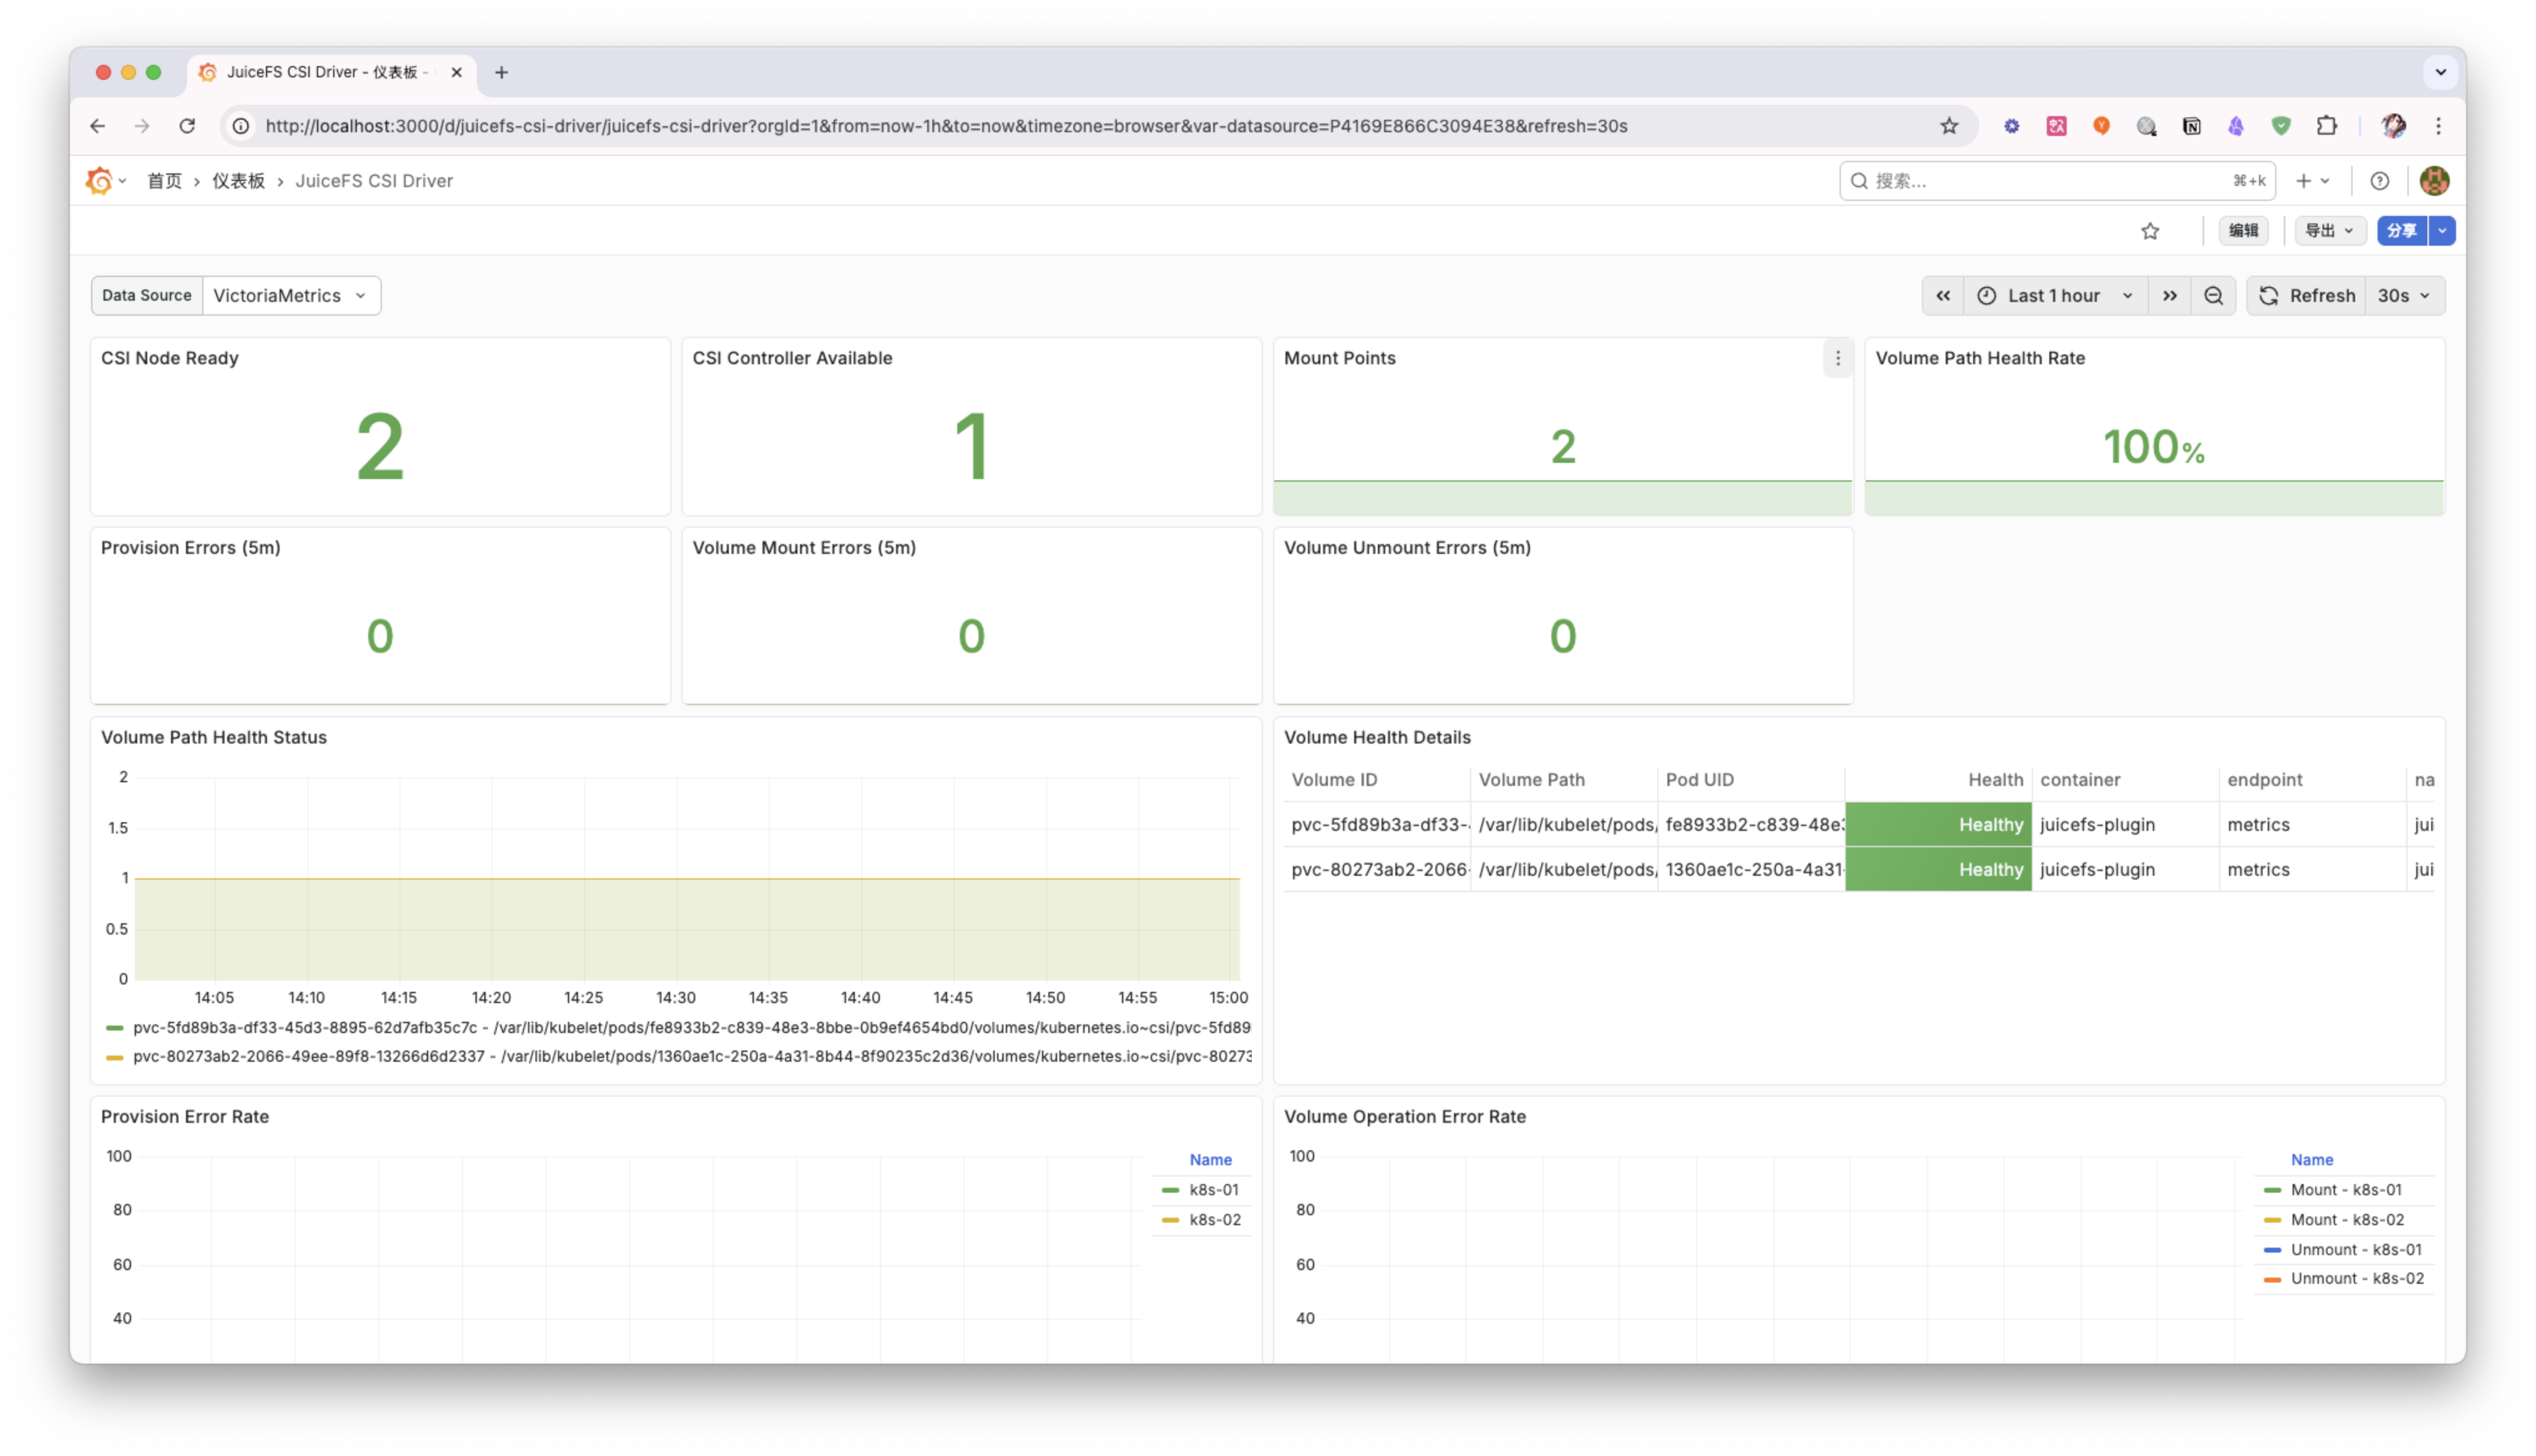
You can adjust and extend this Dashboard according to your needs to better monitor the running status of the JuiceFS CSI Driver.