问题排查方法
阅读本章以了解如何对 JuiceFS CSI 驱动进行问题排查。不论面临何种错误,排查过程都需要你熟悉 CSI 驱动的各个组件及其作用,因此继续阅读前,请确保你已了解 JuiceFS CSI 驱动架构。
排查工具
CSI 控制台
Dashboard 将 CSI 场景下各种排查操作汇集在网页 UI 上,使用起来非常方便,是我们最推荐的排查方式。请阅读「CSI Dashboard」。
kubectl 插件
对于不方便使用 CSI Dashboard 的环境,JuiceFS 额外提供了一个 kubectl 插件,可以通过命令行在 Kubernetes 集群中进行问题排查。
安装
一键安装脚本适用于 Linux 和 macOS 系统,会根据你的硬件架构自动下载安装最新版插件。
# 默认安装到 /usr/local/bin
curl -sSL https://d.juicefs.com/kubectl-jfs-install | sh -
如果环境中已经安装了 krew,也可以使用 krew 来安装:
kubectl krew update
kubectl krew install jfs
安装完毕以后,运行 kubectl jfs 就能打印使用说明:
$ kubectl jfs
tool for juicefs debug in kubernetes

Usage:
  kubectl-jfs [command]

Available Commands:
  accesslog   Collect access logs from the Mount Pod
  completion  Generate the autocompletion script for the specified shell
  debug       Debug a pod, PV, or PVC that is using JuiceFS
  help        Help about any command
  mount       Show the Mount Pod of JuiceFS
  pod         Show pods using a JuiceFS PVC
  pv          Show JuiceFS PVs
  pvc         Show JuiceFS PVCs
  upgrade     Upgrade the Mount Pod smoothly
  warmup      Warm up a subpath of a JuiceFS Mount Pod

Flags:
  -A, --all-namespaces                 If present, list the requested object(s) across all namespaces. The namespace in the current context is ignored, even if specified with --namespace.
      --as string                      Username to impersonate for the operation. The user can be a regular user or a service account in a namespace.
      --as-group stringArray           Group to impersonate for the operation. This flag can be repeated to specify multiple groups.
      --as-uid string                  UID to impersonate for the operation.
      --cache-dir string               Default cache directory (default: "/root/.kube/cache")
      --certificate-authority string   Path to a cert file for the certificate authority
      --client-certificate string      Path to a client certificate file for TLS
      --client-key string              Path to a client key file for TLS
      --cluster string                 The name of the kubeconfig cluster to use
      --context string                 The name of the kubeconfig context to use
      --disable-compression            If true, opt out of response compression for all requests to the server.
  -h, --help                           Help for kubectl-jfs
      --insecure-skip-tls-verify       If true, the server's certificate will not be checked for validity. This will make your HTTPS connections insecure.
      --kubeconfig string              Path to the kubeconfig file to use for CLI requests.
  -m, --mount-namespace string         Namespace of JuiceFS CSI Driver (default: "kube-system")
  -n, --namespace string               If present, the namespace scope for this CLI request
      --request-timeout string         The length of time to wait before giving up on a single server request. Non-zero values should contain a corresponding time unit (e.g., 1s, 2m, or 3h). A value of zero means don't time out requests. (Default: "0")
  -s, --server string                  The address and port of the Kubernetes API server
      --tls-server-name string         Server name to use for server certificate validation. If it is not provided, the hostname used to contact the server is used.
      --token string                   Bearer token for authentication to the API server
      --user string                    The name of the kubeconfig user to use
  -v, --version                        Version for kubectl-jfs
使用
# 快速列出所有使用 JuiceFS PV 的应用 pod
$ kubectl jfs po
NAME                       NAMESPACE  MOUNT PODS                                             STATUS             AGE
cn-wrong-7b7577678d-7j8dc  default    juicefs-cn-hangzhou.10.0.1.84-ce-static-handle-qhuuvh  CrashLoopBackOff   10d
image-wrong                default    juicefs-cn-hangzhou.10.0.1.84-ce-static-handle-qhuuvh  ImagePullBackOff   10d
multi-mount-pod            default    juicefs-cn-hangzhou.10.0.1.84-ce-another-ilkzmy,       Running            11d
                                      juicefs-cn-hangzhou.10.0.1.84-ce-static-handle-qhuuvh
normal-664f8b8846-ntfzk    default    juicefs-cn-hangzhou.10.0.1.84-ce-static-handle-qhuuvh  Running            11d
pending                    default    <none>                                                 Pending            11d
res-err                    default    <none>                                                 Pending            11d
terminating                default    <none>                                                 Terminating        10d
wrong                      default    juicefs-cn-hangzhou.10.0.1.84-wrong-nvblwj             ContainerCreating  10d

# 快速列出所有 JuiceFS Mount Pod。默认 Mount Pod 在 kube-system 下,可以用 -m 参数指定 Mount Pod 所在命名空间
$ kubectl jfs mount
NAME                                                   NAMESPACE    APP PODS                            STATUS   CSI NODE                AGE
juicefs-cn-hangzhou.10.0.1.84-ce-another-ilkzmy        kube-system  default/multi-mount-pod             Running  juicefs-csi-node-v6pq5  11d
juicefs-cn-hangzhou.10.0.1.84-ce-static-handle-qhuuvh  kube-system  default/cn-wrong-7b7577678d-7j8dc,  Running  juicefs-csi-node-v6pq5  11d
                                                                    default/image-wrong,
                                                                    default/multi-mount-pod,
                                                                    default/normal-664f8b8846-ntfzk
juicefs-cn-hangzhou.10.0.1.84-wrong-nvblwj             kube-system  default/wrong                       Running  juicefs-csi-node-v6pq5  10d

# 快速列出所有 JuiceFS PV / PVC
$ kubectl jfs pv
$ kubectl jfs pvc
对于有问题的应用 Pod、PVC、PV,还可以使用以下功能进行初步诊断,JuiceFS plugin 会提示下一步的排查方向:
# 诊断应用 pod
$ kubectl jfs debug pod wrong
Name:        wrong
Namespace:   default
Start Time:  Mon, 24 Jun 2024 15:15:52 +0800
Status:      ContainerCreating
Node:
  Name:    cn-hangzhou.10.0.1.84
  Status:  Ready
CSI Node:
  Name:       juicefs-csi-node-v6pq5
  Namespace:  kube-system
  Status:     Ready
PVCs:
  Name   Status  PersistentVolume
  ----   ------  ----------------
  wrong  Bound   wrong
Mount Pods:
  Name                                        Namespace    Status
  ----                                        ---------    ------
  juicefs-cn-hangzhou.10.0.1.84-wrong-nvblwj  kube-system  Error
Failed Reason:
  Mount pod [juicefs-cn-hangzhou.10.0.1.84-wrong-nvblwj] is not ready, please check its log.

# 诊断 JuiceFS PVC
$ kubectl jfs debug pvc <pvcName>
$ kubectl jfs debug pv <pvName>
另外,还提供了快速获取 Mount Pod 访问日志以及快速预热缓存的功能:
# 获取 Mount Pod 访问日志:kubectl jfs accesslog <pod-name> -m <mount-namespace>
$ kubectl jfs accesslog juicefs-cn-hangzhou.10.0.1.84-ce-static-handle-qhuuvh
2024.07.05 14:09:57.392403 [uid:0,gid:0,pid:201] open (9223372032559808513): OK [fh:25] <0.000054>
#

# 预热缓存:kubectl jfs warmup <pod-name> <subpath> -m <mount-namespace>
$ kubectl jfs warmup juicefs-cn-hangzhou.10.0.1.84-ce-static-handle-qhuuvh
2024/07/05 14:10:52.628976 juicefs[207] <INFO>: Successfully warmed up 2 files (1090721713 bytes) [warmup.go:226]
诊断脚本(不推荐)
由于已经有功能更为强大的 kubectl 插件,本小节介绍的脚本已经不再推荐使用。
推荐使用诊断脚本 csi-doctor.sh 来收集日志及相关信息,本章所介绍的排查手段中,大部分采集信息的命令,都在脚本中进行了集成,使用起来更为便捷。
在集群中任意一台可以执行 kubectl 的节点上��,安装诊断脚本:
wget https://raw.githubusercontent.com/juicedata/juicefs-csi-driver/master/scripts/csi-doctor.sh
chmod a+x csi-doctor.sh
如果在你的运行环境中,kubectl 被重命名(比方说需要管理多个 Kubernetes 集群时,常常用不同 alias 来调用不同集群的 kubectl),或者并未放在 PATH 下,你也可以方便地修改脚步,将 $kbctl 变量替换为实际需要运行的 kubectl:
# 假设面对两个不同集群,kubectl 分别被别名为 kubectl_1 / kubectl_2
KBCTL=kubectl_1 ./csi-doctor.sh debug my-app-pod -n default
KBCTL=kubectl_2 ./csi-doctor.sh debug my-app-pod -n default
诊断脚本中最为常用的功能,就是方便地获取 Mount Pod 相关信息。假设应用 Pod 为 default 命名空间下的 my-app-pod:
# 获取指定应用 Pod 所用的 Mount Pod
$ ./csi-doctor.sh get-mount my-app-pod
kube-system juicefs-ubuntu-node-2-pvc-b94bd312-f5f7-4f46-afdb-2d1bc20371b5-whrrym

# 获取使用指定 Mount Pod 的所有应用 Pod
$ ./csi-doctor.sh get-app juicefs-ubuntu-node-2-pvc-b94bd312-f5f7-4f46-afdb-2d1bc20371b5-whrrym
default my-app-pod
在你熟读了「基础问题排查原则」后,还可以使用 csi-doctor.sh debug 命令,来快速收集组件版本和日志信息。各类常见问题,均能在命令输出中找到排查线索:
./csi-doctor.sh debug my-app-pod -n default
运行上方命令,检查打印出来的丰富排查信息,用下方介绍的排查原则来进行诊断。同时,该命令控制输出内容的规模,你可以根据所使用的 JuiceFS 版本,方便地拷贝并发送给开源社区,或者 Juicedata 团队,进行后续排查。
基础问题排查原则
在 JuiceFS CSI 驱动中,常见错误有两种:一种是 PV 创建失败,属于 CSI Controller 的职责;另一种是应用 Pod 创建失败,属于 CSI Node 和 Mount Pod 的职责。
PV 创建失败
在「动态配置」下,PVC 创建之后,CSI Controller 会同时配合 kubelet 自动创建 PV。在此期间,CSI Controller 会在 JuiceFS 文件系统中创建以 PV ID 为名的子目录(如果不希望以 PV ID 命名子目录,可以通过 pathPattern 来调整)。
查看 PVC 事件
一般而言,如果创建子目录失败,CSI Controller 会将错误结果存在 PVC 事件中:
$ kubectl describe pvc dynamic-ce
...
Events:
  Type     Reason       Age                From               Message
  ----     ------       ----               ----               -------
  Normal   Scheduled    27s                default-scheduler  Successfully assigned default/juicefs-app to cluster-0003
  Warning  FailedMount  11s (x6 over 27s)  kubelet            MountVolume.SetUp failed for volume "juicefs-pv" : rpc error: code = Internal desc = Could not mount juicefs: juicefs auth error: Failed to fetch configuration for volume 'juicefs-pv', the token or volume is invalid.
检查 CSI Controller
若 PVC 事件中并无错误信息,我们需要检查 CSI Controller 容器是否存活,以及是否存在异常日志:
# 检查 CSI Controller 是否存活
$ kubectl -n kube-system get po -l app=juicefs-csi-controller
NAME                       READY   STATUS    RESTARTS   AGE
juicefs-csi-controller-0   3/3     Running   0          8d

# 检查 CSI Controller 日志是否存在异常信息
$ kubectl -n kube-system logs juicefs-csi-controller-0 juicefs-plugin
应用 Pod 创建失败
在 CSI 驱动的架构下,JuiceFS 客户端运行在 Mount Pod 中。因此每一个应用 Pod 都伴随着一个对应的 Mount Pod。
CSI Node 会负责创建 Mount Pod 并在其中挂载 JuiceFS 文件系统,最终将挂载点 bind 到应用 Pod 内。因此如果应用 Pod 创建失败,既可能是 CSI Node 的问题,也可能是 Mount Pod 的问题,需要逐一排查。
查看应用 Pod 事件
若挂载期间有报错,��报错信息往往出现在应用 Pod 事件中:
$ kubectl describe po dynamic-ce-1
...
Events:
  Type     Reason       Age               From               Message
  ----     ------       ----              ----               -------
  Normal   Scheduled    53s               default-scheduler  Successfully assigned default/ce-static-1 to ubuntu-node-2
  Warning  FailedMount  4s (x3 over 37s)  kubelet            MountVolume.SetUp failed for volume "ce-static" : rpc error: code = Internal desc = Could not mount juicefs: juicefs status 16s timed out
通过应用 Pod 事件确认创建失败的原因与 JuiceFS 有关以后,可以按照下面的步骤逐一排查。
检查 CSI Node
首先,我们需要检查应用 Pod 所在节点的 CSI Node 容器是否存活,以及是否存在异常日志:
# 提前将应用 pod 信息存为环境变量
APP_NS=default  # 应用所在的 Kubernetes 命名空间
APP_POD_NAME=example-app-xxx-xxx

# 通过应用 pod 找到节点名
NODE_NAME=$(kubectl -n $APP_NS get po $APP_POD_NAME -o jsonpath='{.spec.nodeName}')

# 打印出所有 CSI Node pods
kubectl -n kube-system get po -l app=juicefs-csi-node

# 打印应用 pod 所在节点的 CSI Node pod
kubectl -n kube-system get po -l app=juicefs-csi-node --field-selector spec.nodeName=$NODE_NAME

# 将下方 $CSI_NODE_POD 替换为上一条命令获取到的 CSI Node pod 名称,检查日志,确认有无异常
kubectl -n kube-system logs $CSI_NODE_POD -c juicefs-plugin
或者直接用一行命令打印出应用 Pod 对应的 CSI Node Pod 日志(需要设置好 APP_NS 和 APP_POD_NAME 环境变量):
kubectl -n kube-system logs $(kubectl -n kube-system get po -o jsonpath='{..metadata.name}' -l app=juicefs-csi-node --field-selector spec.nodeName=$(kubectl get po -o jsonpath='{.spec.nodeName}' -n $APP_NS $APP_POD_NAME)) -c juicefs-plugin
检查 Mount Pod
如果 CSI Node 一切正常,则需要检查 Mount Pod 是否存在异常。
你可以方便地通过 kubectl jfs 插件来快速定位到应用 Pod 对应的 Mount Pod:
$ kubectl jfs po --all-namespaces
NAME               NAMESPACE    MOUNT PODS               STATUS   AGE
juicefs-app        default      juicefs-k8s-001-pvc-xxx  Running  6s
根据上方打印出来的 Mount Pod 名称,用 kubectl describe 和 kubectl logs --all-containers 命令查看容器事件和日志,进行深入排查。
如果你需要脱离脚本、直接用 kubectl 进行排查,我们也准备了一系列快捷命令,帮你方便地获取信息:
# 通过 App Pod 反查 Mount Pod,可以通过下方命令先提取 Pod UID
# 注意替换最后的 juicefs-app 为实际应用 Pod 名称
k get po -n default -ojsonpath='{..metadata.uid}{"\n"}' juicefs-app
# 复制上一条命令打印的 UID,然后在结果中搜索,UID 匹配的记录,就是该应用 Pod 所关联的 Mount Pod
kubectl get pods -o=custom-columns=NAME:.metadata.name,ANNOTATIONS:.metadata.annotations -l app.kubernetes.io/name=juicefs-mount -n kube-system|grep UID

# 定位到 Mount Pod 以后,查看 Events 和日志
kubectl -n kube-system describe [Mount Pod Name]
kubectl -n kube-system logs --all-containers [Mount Pod Name]

# 如果有需要,还可以直接用下方命令打印所有 Mount Pod 错误日志
kubectl -n kube-system logs -l app.kubernetes.io/name=juicefs-mount | grep -v "<WARNING>" | grep -v "<INFO>"
排查 Mount Pod
一个处于 CrashLoopBackOff 状态的容器是无法进行交互式排查的,此时可以使用 kubectl debug 命令,创建一个可交互排查的副本:
kubectl -n <namespace> debug <mount-pod> -it --copy-to=jfs-mount-debug --container=jfs-mount --image=<mount-image> -- bash
在上方示范中,<mount-image> 设置为该 Mount Pod 的镜像,这样一来,debug 命令会创建一个一模一样的专供交互式排查的容器,你可以在这个环境中尝试复现、排查问题。
排查完毕以后,记得清理环境:
kubectl -n <namespace> delete po jfs-mount-debug
性能问题
如果使用 CSI 驱动时,各组件均无异常,但却遇到了性能问题,则需要用到本节介绍的排查方法。
查看实时统计数据以及访问日志
JuiceFS 文件系统的根目录下有一些提供特殊功能的隐藏文件,假设挂载点为 /jfs:
cat /jfs/.accesslog实时打印文件系统的访问日志,用于分析应用程序对文件系统的访问模式,详见「访问日志(社区版)」和「访问日志(云服务)」juicefs stats -l 1 /jfs打印文件系统的实时统计数据,当 JuiceFS 性能不佳时,可以通过实时统计数据判断问题所在。详见「实时统计数据(社区版)」和「实时统计数据(云服务)」
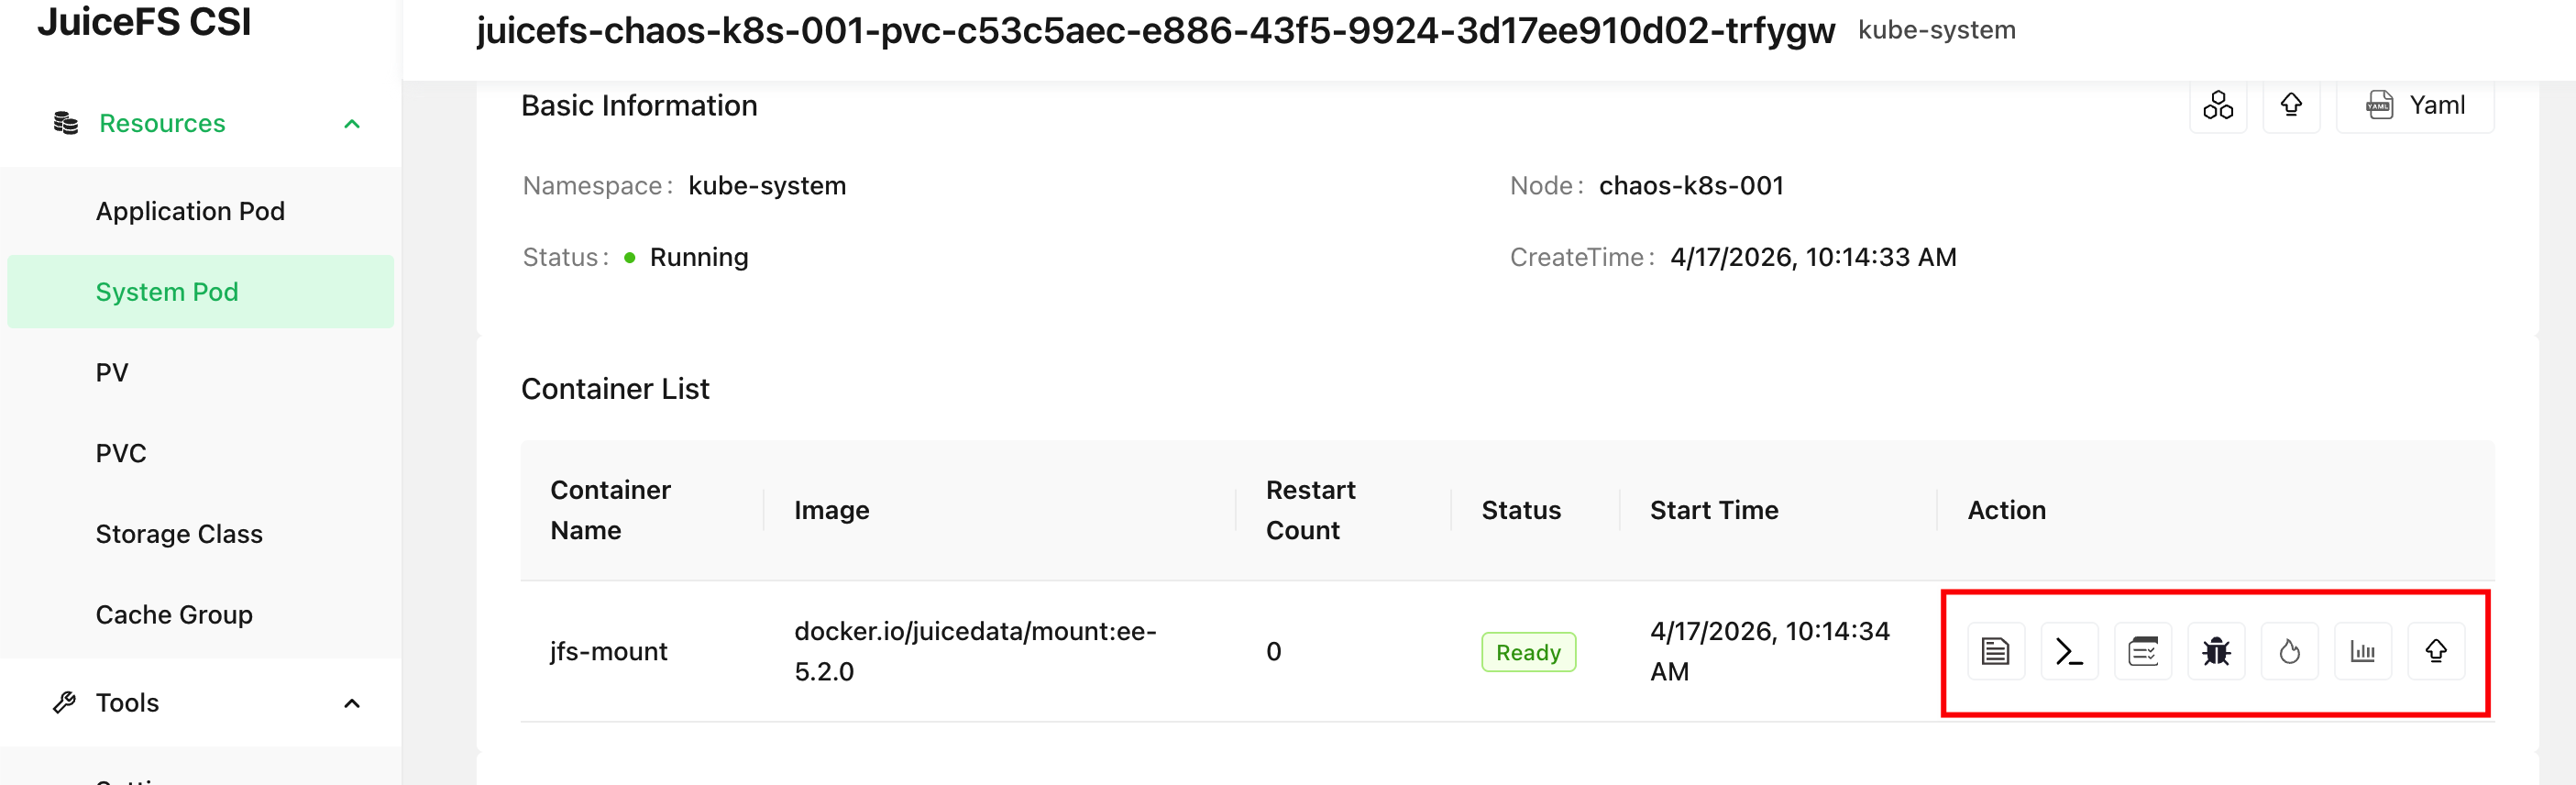
如果已经安装了 CSI Dashboard,则可直接通过网页功能采集日志和 stats 信息:
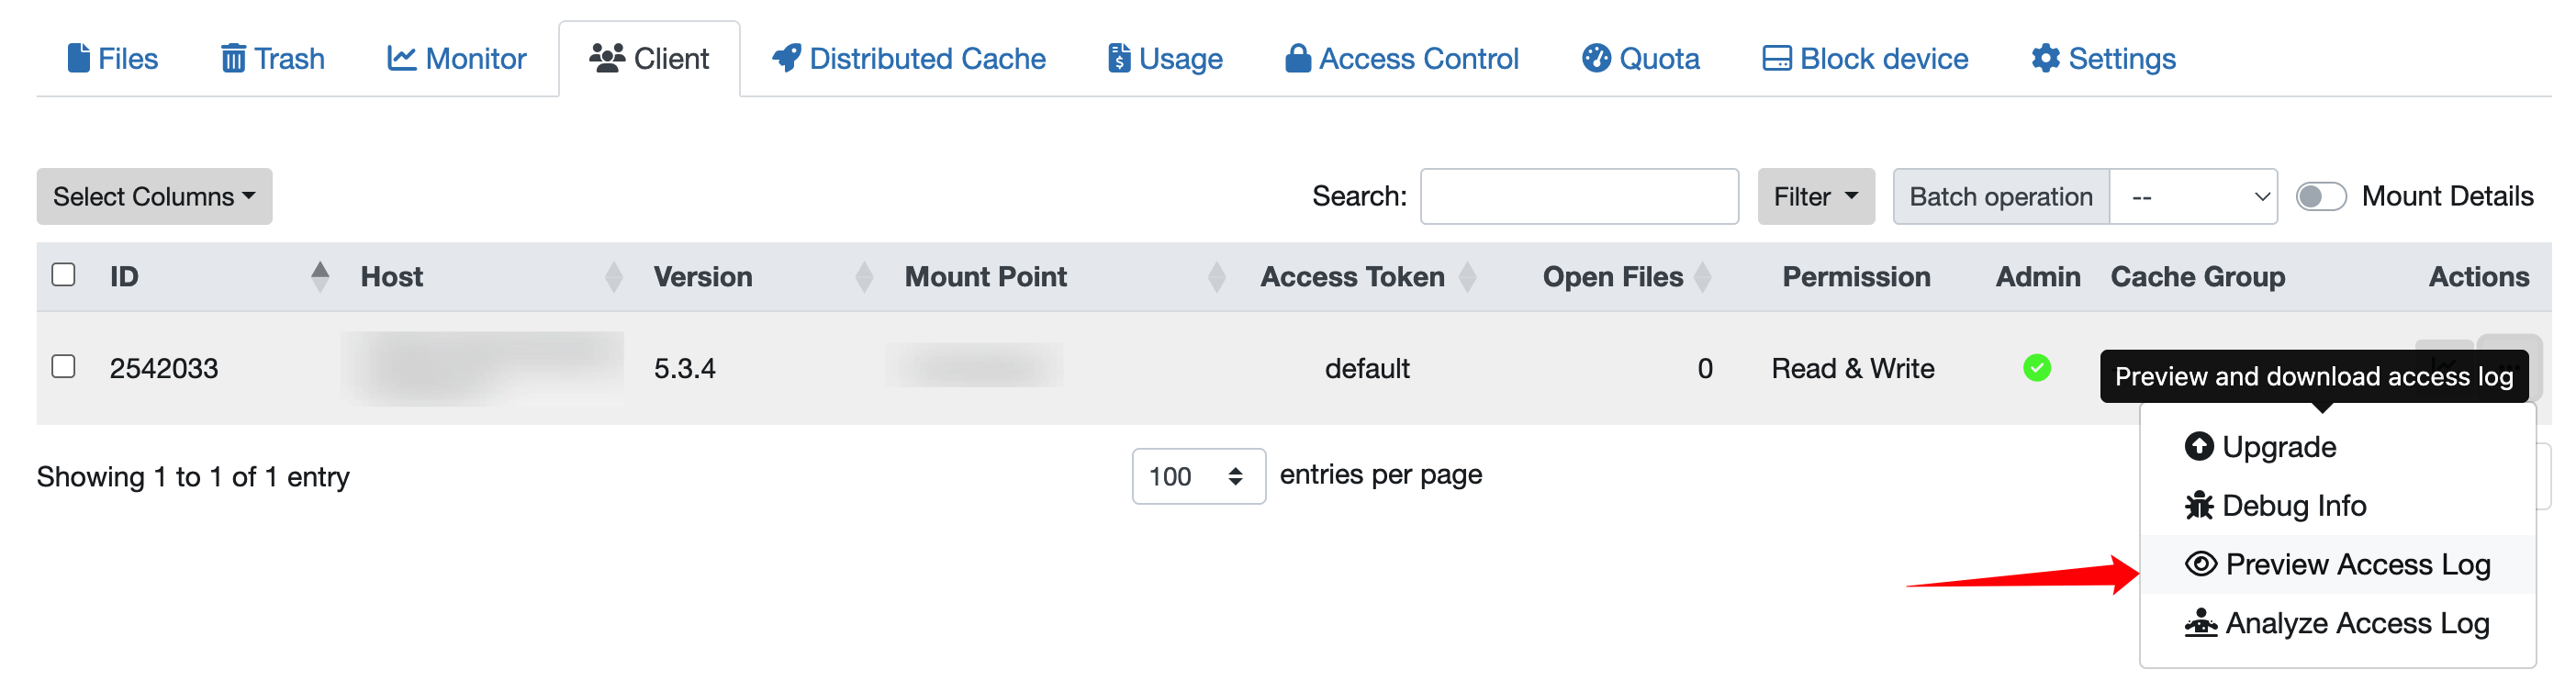
对于 JuiceFS 企业版用户,如果并未安装 CSI Dashboard,也可以直接通过控制台进入文件系统的客户端列表页,点击最右侧对应的按钮直接采集和下载日志:
如果无法通过网页功能完成上述功能,还可以使用 kubectl jfs accesslog 命令来提取访问日志。
JuiceFS 挂载点的性能是一个单独的�话题,请额外参考以下内容: