Production Cluster Performance
TCP cluster benchmark performance
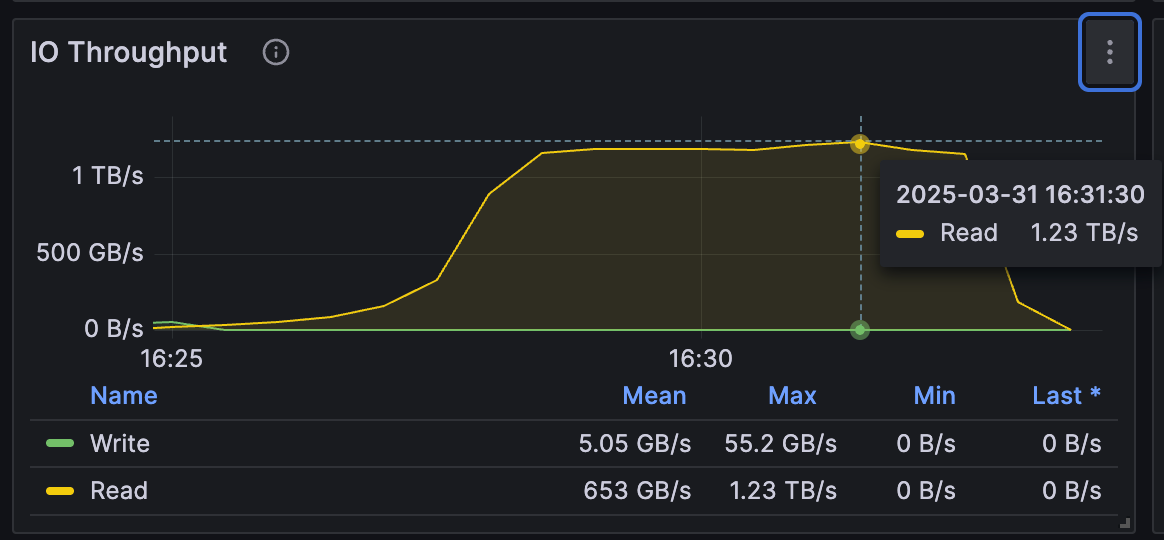
Node specifications: 32 CPU cores | 128 GiB memory | 100 Gbps NIC × 100 nodes
Software: Ubuntu 22.04 and JuiceFS 5.2
JuiceFS achieved 1.23 TB/s aggregate throughput across 100 cache nodes, reaching 98% bandwidth utilization.
For this benchmark, we provisioned 100 virtual machines on GCP, each with 32 CPU cores, 128 GiB memory, a 100 Gbps NIC, and two 3.84 TiB NVMe drives. To saturate the 100 Gbps NIC bandwidth without making the disks a bottleneck, we allocated 50% of each node's memory to the cache pool. Together, the two NVMe drives and memory cache consistently delivered enough throughput to saturate each node's 100 Gbps outbound bandwidth, ensuring that storage was not the bottleneck on any cache node.
These 100 nodes also served as application client nodes, consuming the distributed cache in peer-to-peer mode. The test demonstrated that, on GCP with full-duplex 100 Gbps Ethernet NICs, JuiceFS can nearly saturate each node's 100 Gbps inbound and outbound network bandwidth for reads and writes. This performance is made possible by:
- The consistent hashing algorithm used by the Enterprise Edition distributed cache, which distributes data blocks evenly across nodes to prevent hotspots.
- Optimized zero-copy and multiplexing algorithms, which minimize throughput overhead and reduce CPU consumption.
RDMA cluster benchmark performance
JuiceFS 5.3 introduced RDMA support. The test environment was configured as follows:
Cache nodes:
128 CPU cores | 500 GiB memory | 4 × 400 Gbps InfiniBand NICs | 10 NVMe drives × 3 nodes, providing a theoretical maximum distributed cache throughput of 300 GB/s
Client nodes:
128 CPU cores | 500 GiB memory | 2 × 400 Gbps InfiniBand NICs | Sufficient network bandwidth; however, due to FUSE limitations, each node can achieve a maximum download throughput of 60 GB/s. Multiple clients are required to saturate the cache nodes' outbound bandwidth.
Sequential read
The fio command used for concurrent sequential read testing:
fio --name=seq --directory=/jfs --filename_format=file.\$jobnum.dat --size=1G --bs=1M --rw=read --numjobs=36 --iodepth=1 --ioengine=libaio --direct=1 --time_based --runtime=2000 --group_reporting
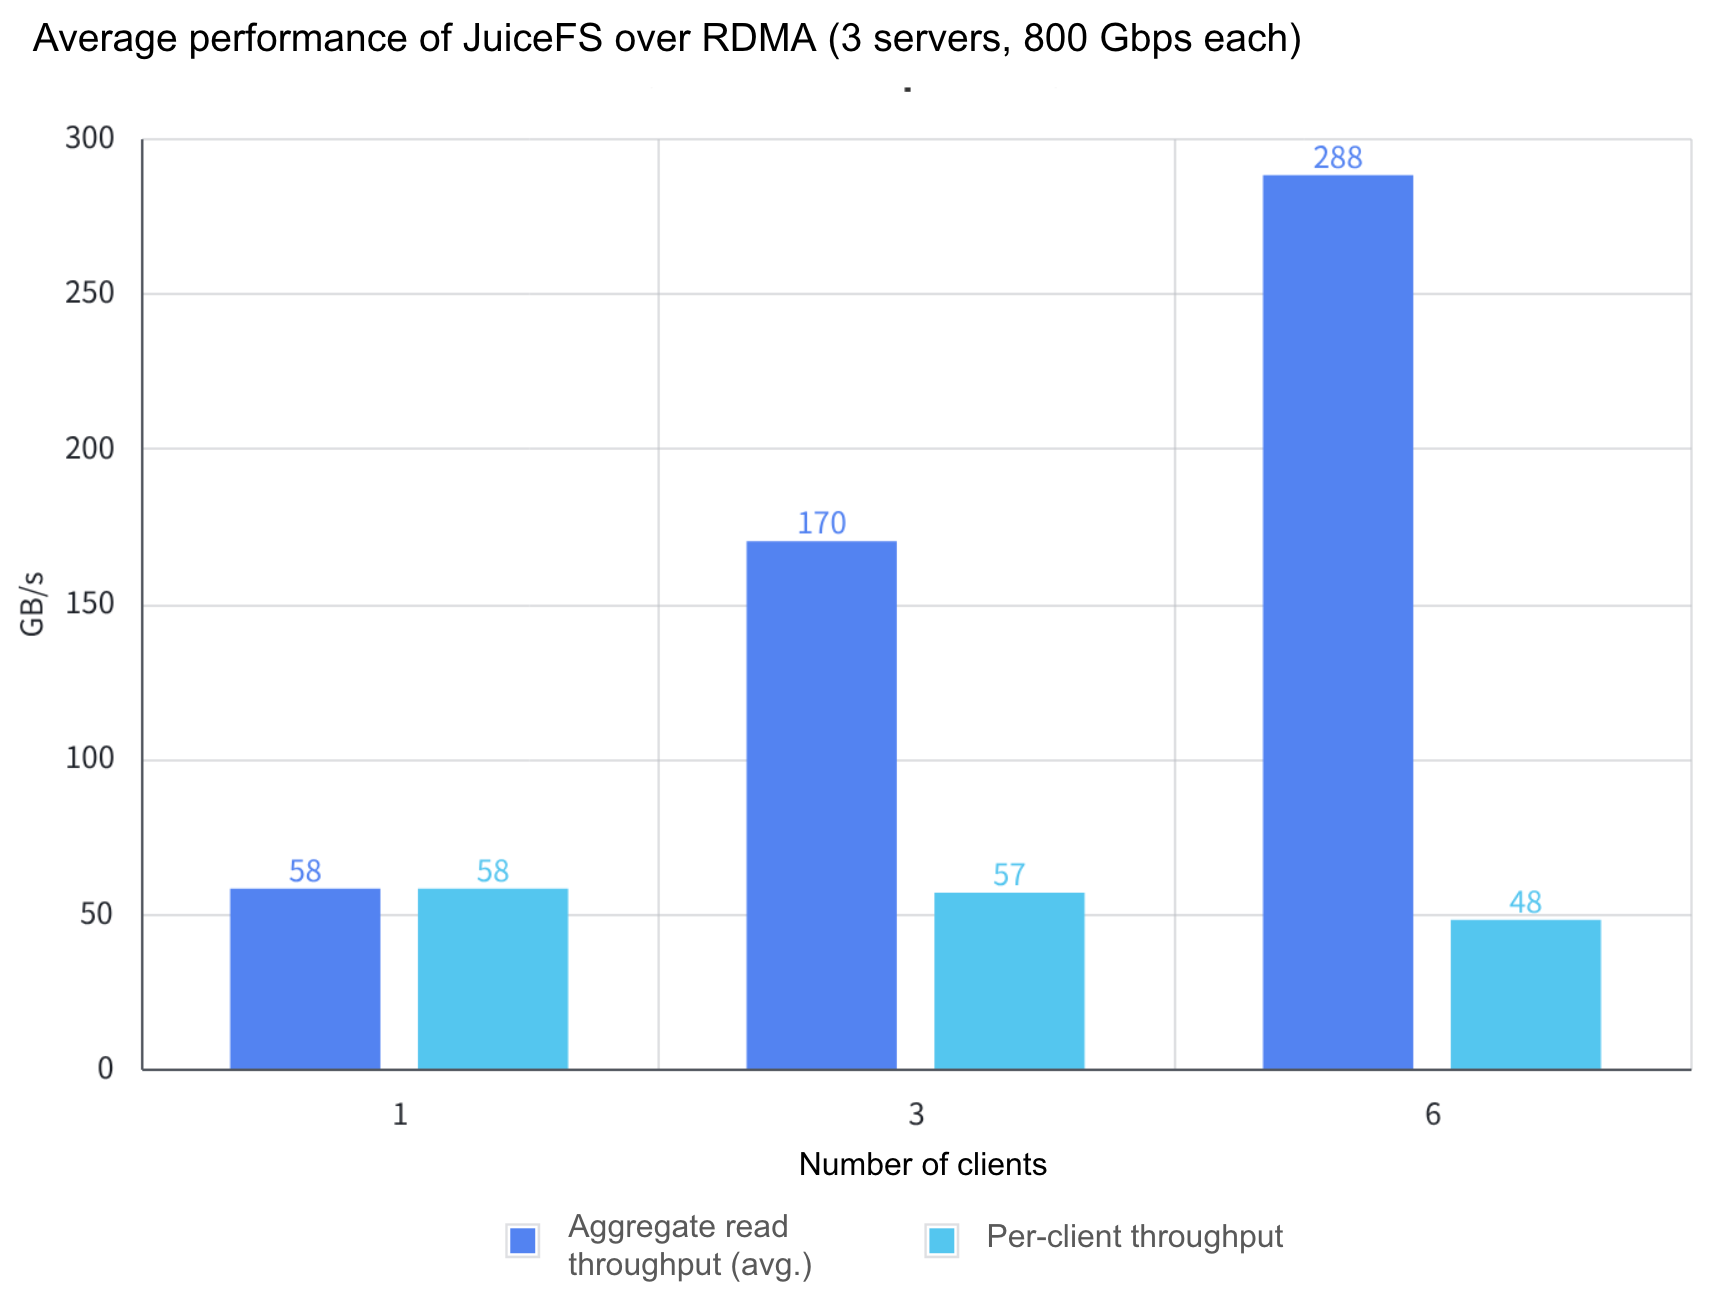
Test results:
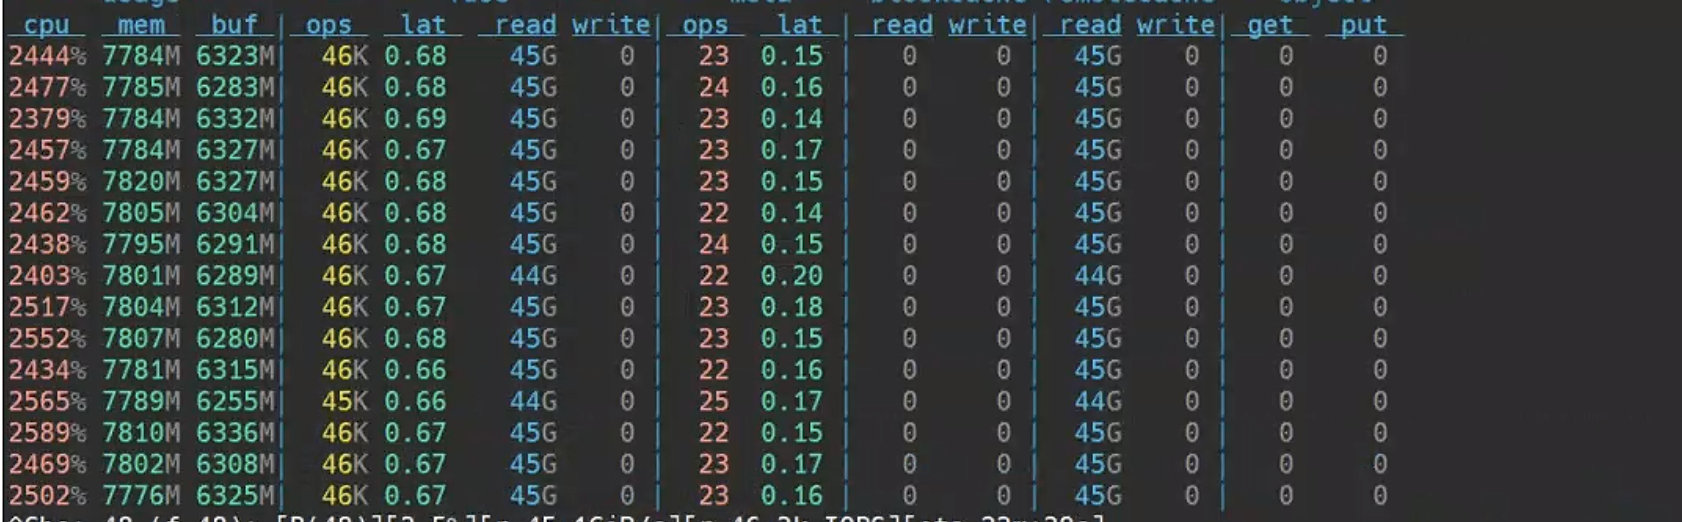
- Average RDMA NIC utilization reached 96%. With an aggregate bandwidth of 6 × 400 Gbps, the test delivered an average throughput of 288 GB/s. (Figure 1)
- The maximum single-node RDMA throughput currently measured with a FUSE client reached 60 GB/s, more than twice the 25 GB/s achieved with TCP. Increasing the load further, even with two mount points, did not increase aggregate throughput.
- The reported aggregate throughput represents the average across all test runs. For example, the six client nodes occasionally exceeded 300 GB/s, with bandwidth utilization above 100%. However, backend monitoring showed that the aggregate outbound bandwidth of the cache nodes also exceeded 2 × 400 Gbps at those times. The average is therefore used to eliminate network fluctuations and better represent real-world performance. (Figure 2)
- Each cache server was equipped with 10 local NVMe drives and one system disk. At full load, a single node delivered up to 91 GB/s of read throughput, compared with only 48 GB/s from memory alone, which was enough to nearly saturate two 400 Gbps NICs. (Figure 3)
- RDMA client CPU consumption remained at approximately 25 cores. (Figure 4)
Figure 1: Average aggregate bandwidth

Figure 2: Application traffic
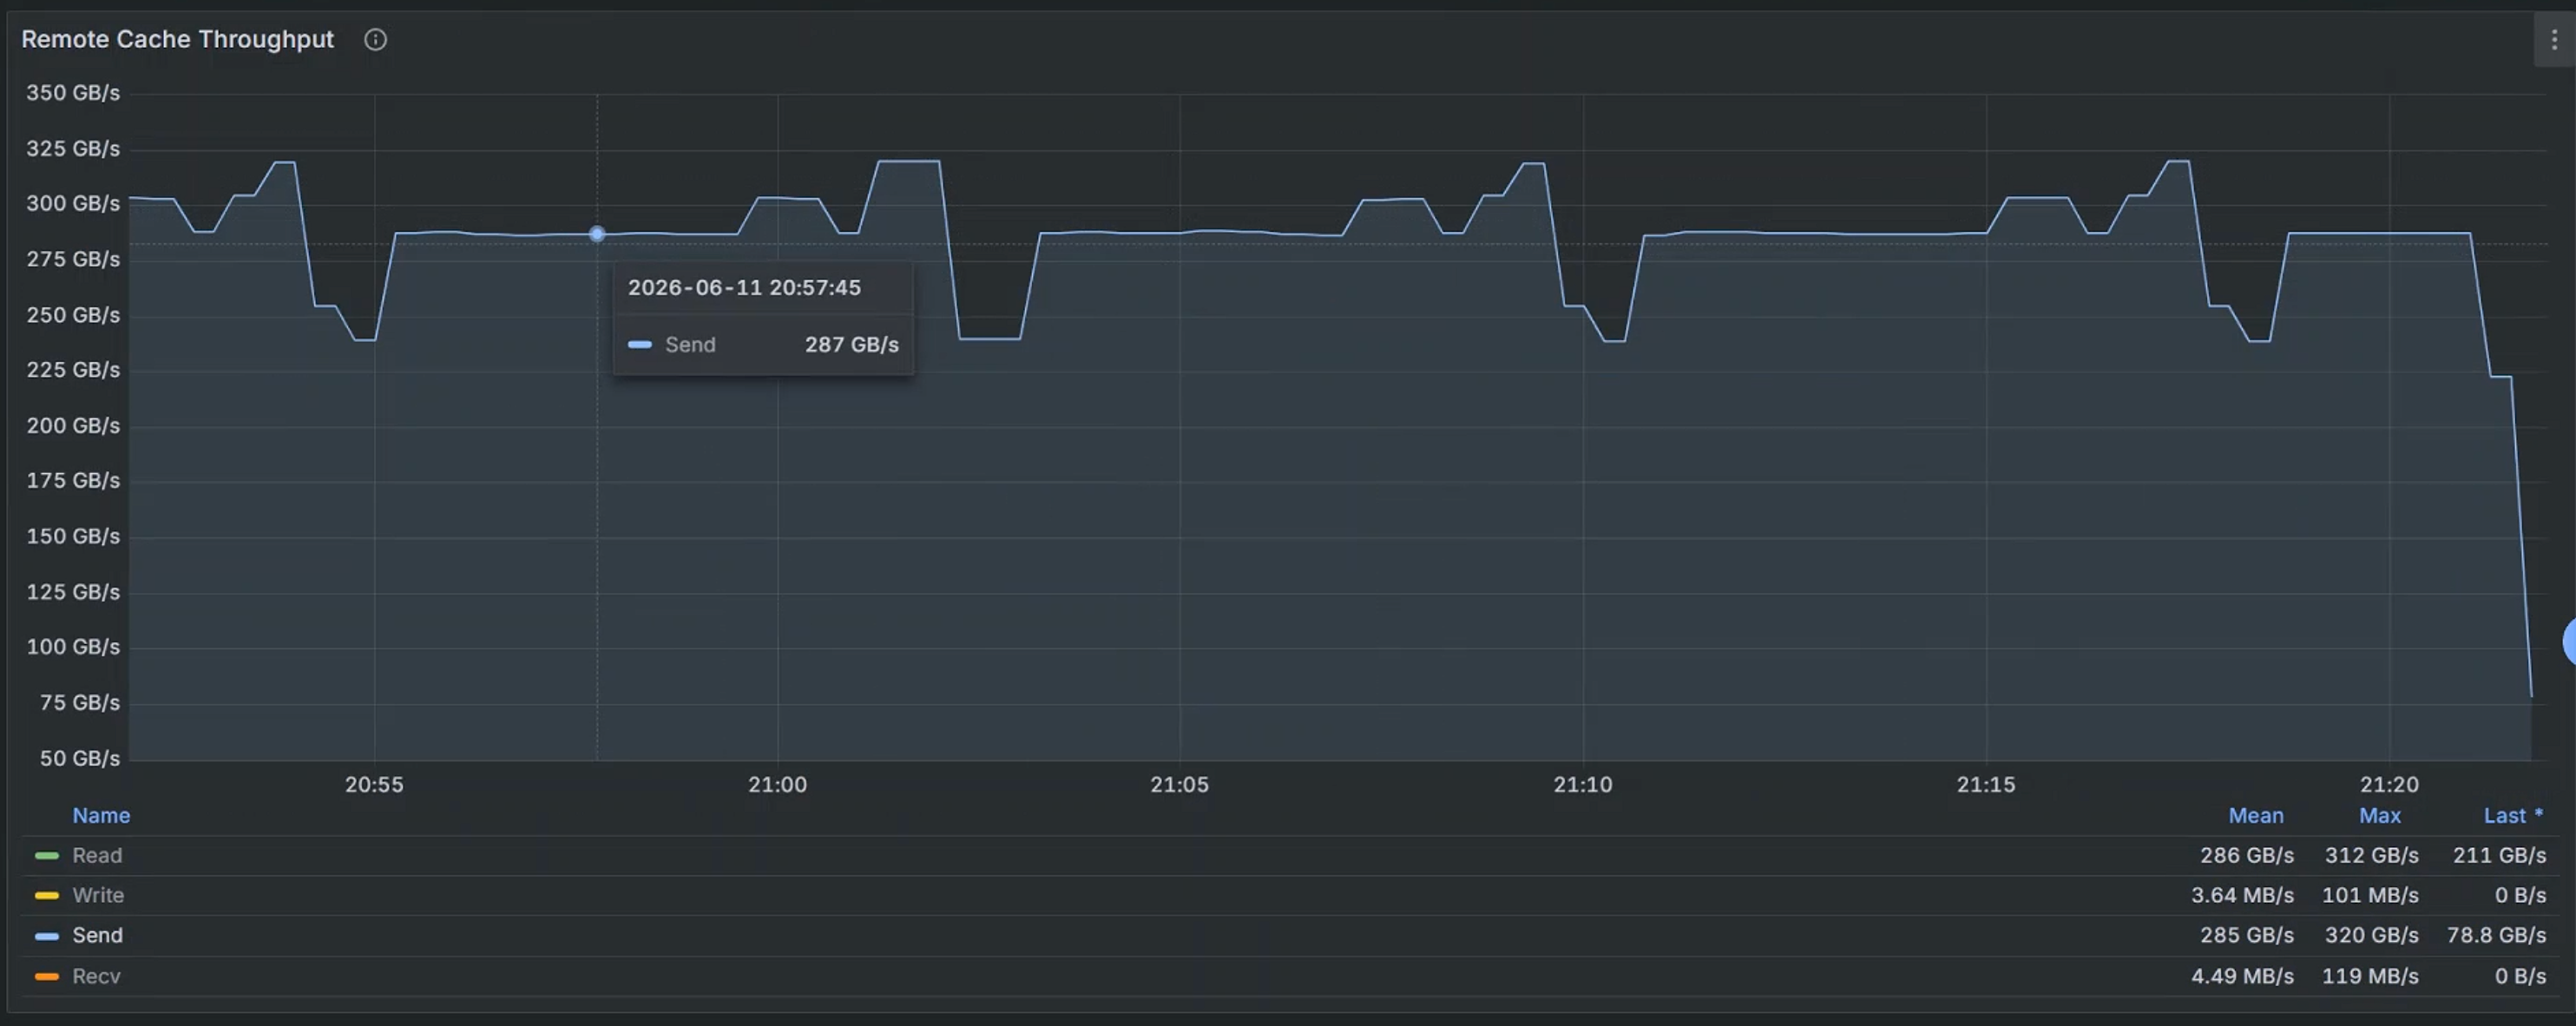
Figure 3: Cache node disk read traffic
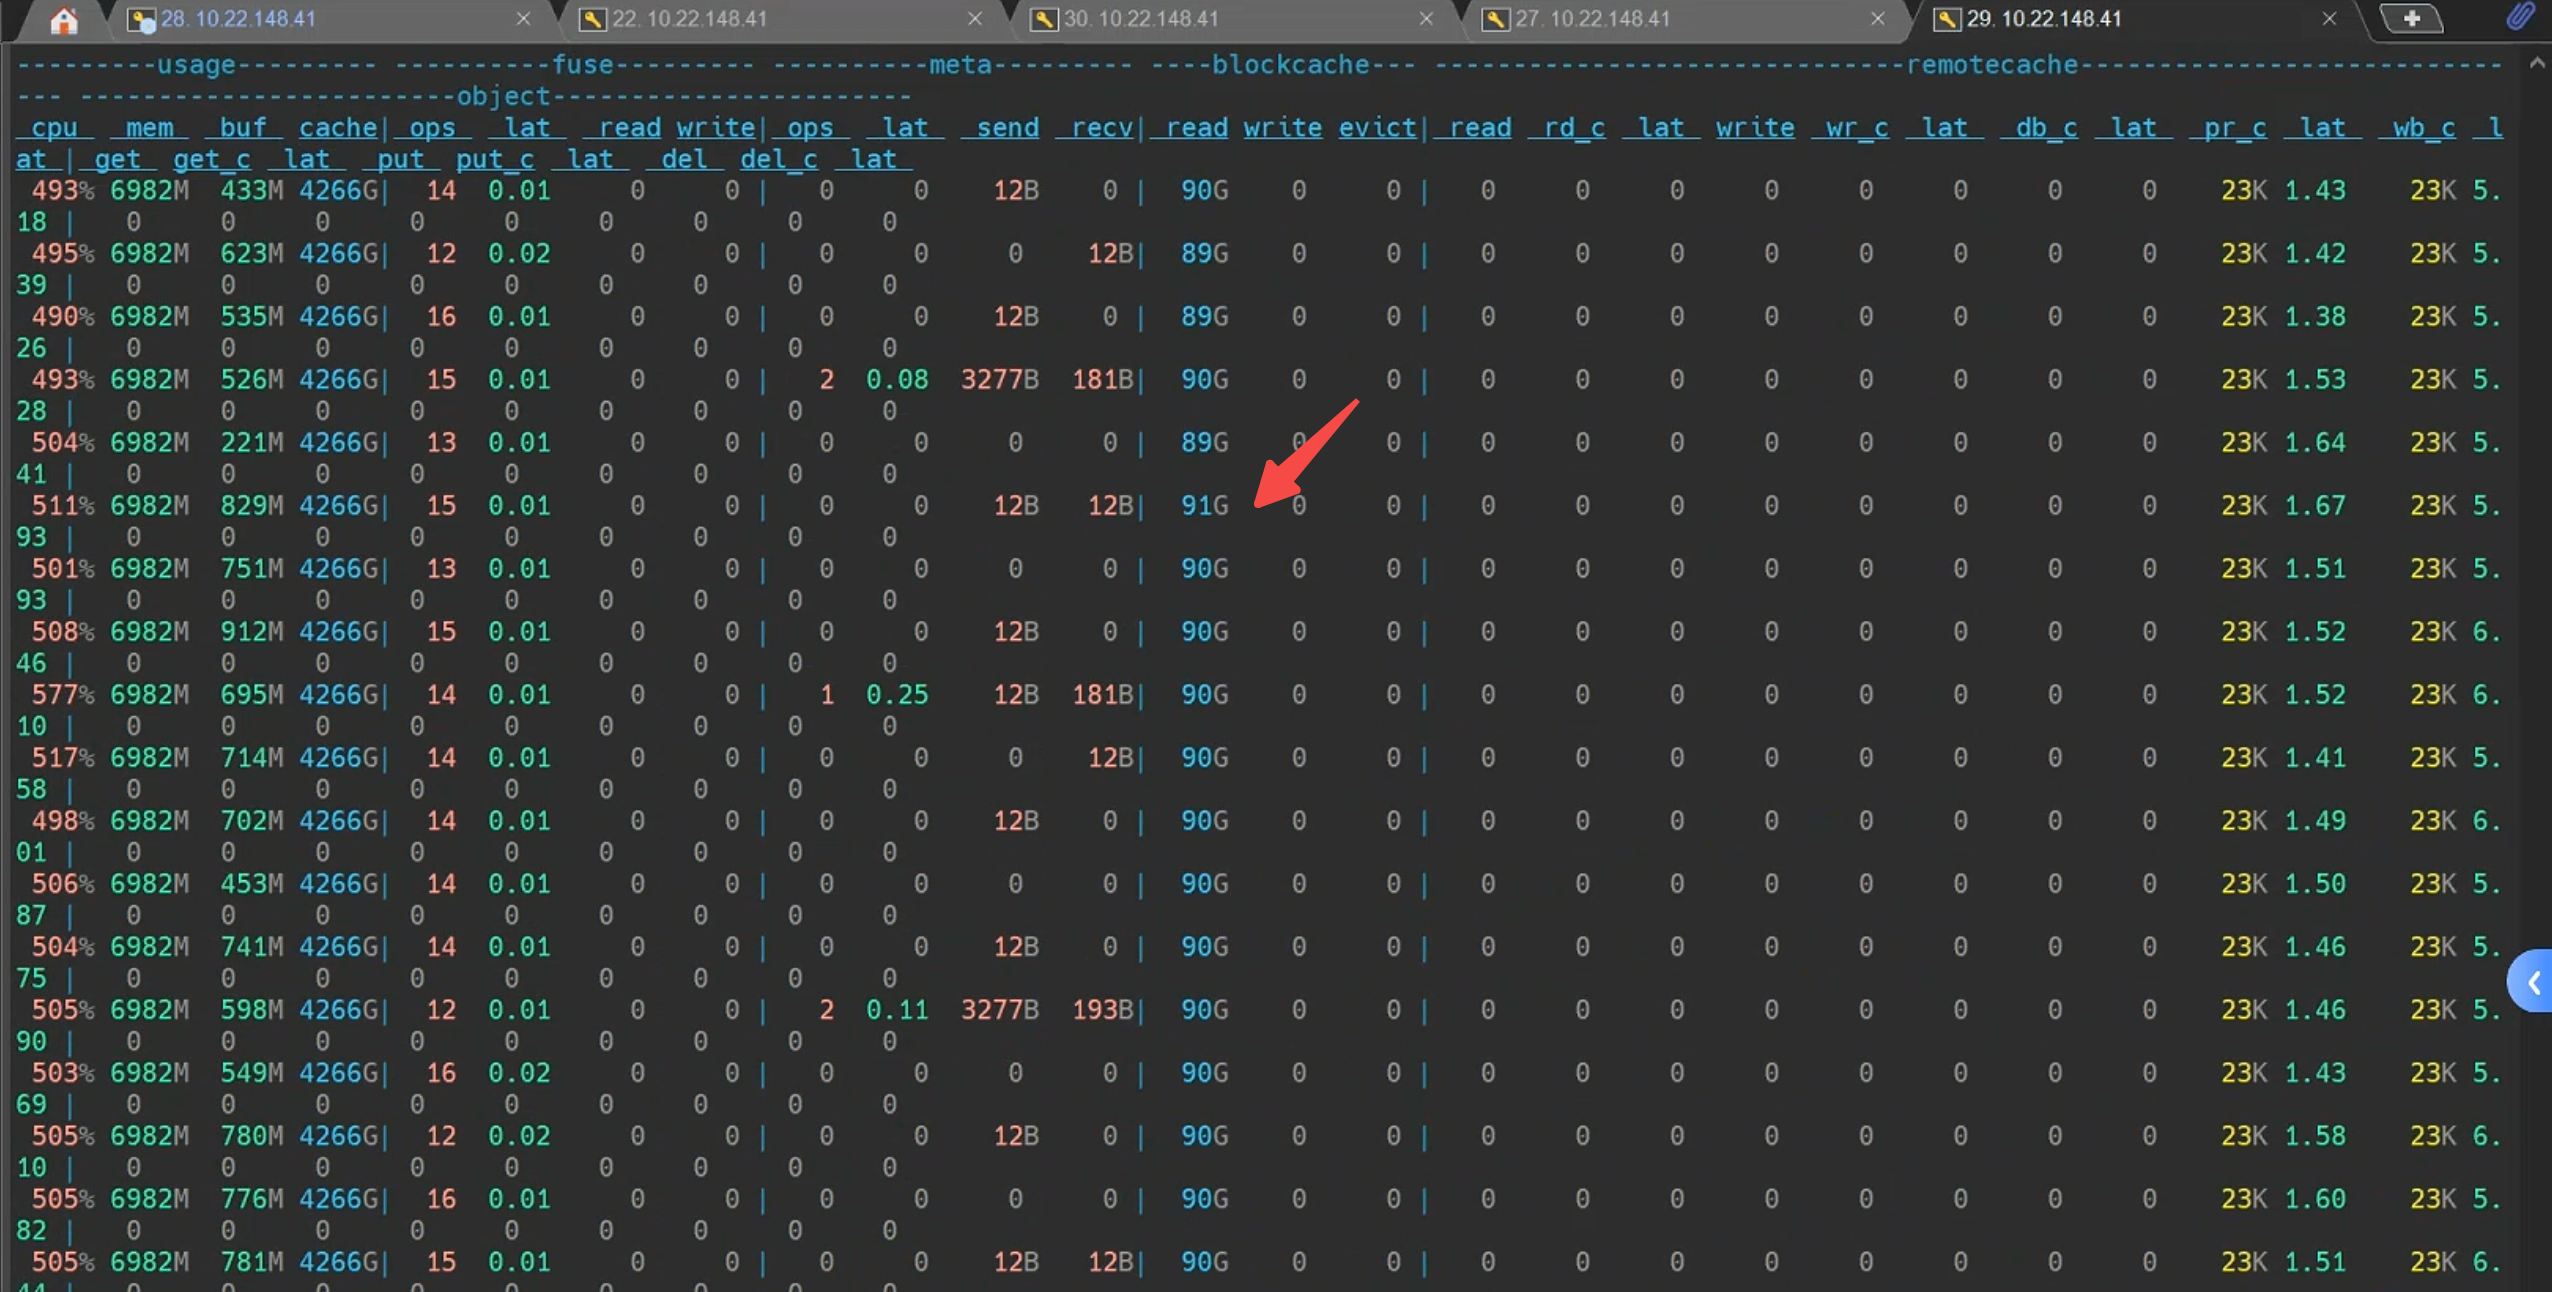
Figure 4: RDMA client CPU utilization
Customer production performance
The following data reflects JuiceFS performance under real-world customer workloads and does not represent maximum performance.
Autonomous driving customer
Production performance overview
The following data shows JuiceFS performance in the production environment of an autonomous driving company, where JuiceFS Enterprise Edition has been running for more than 12 months.
System scale
- Total file system capacity: 30 PB
- Number of files (inodes): 400 million
- Client compute nodes: 7,480
- Distributed cache nodes: 135
- Distributed cache capacity: 4.7 PB
Key performance indicators
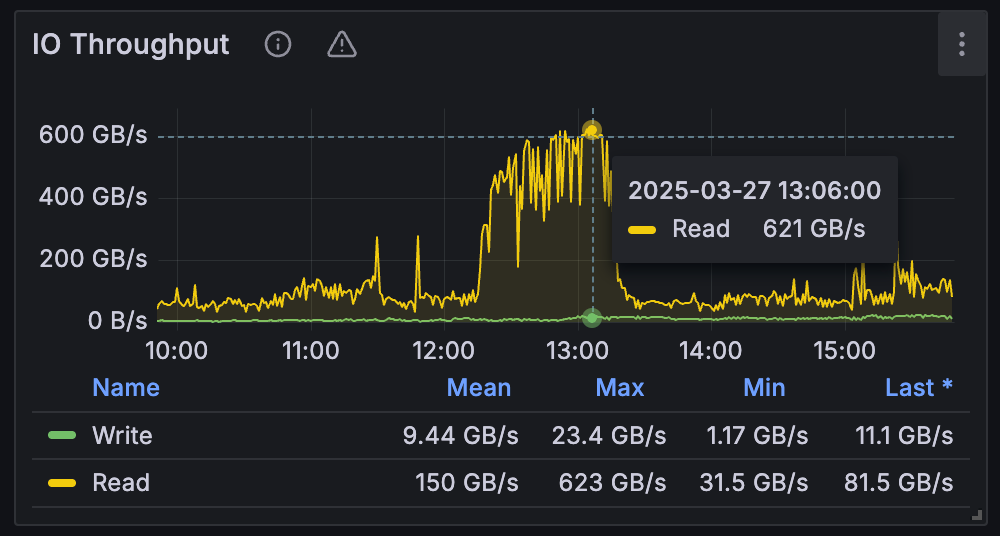
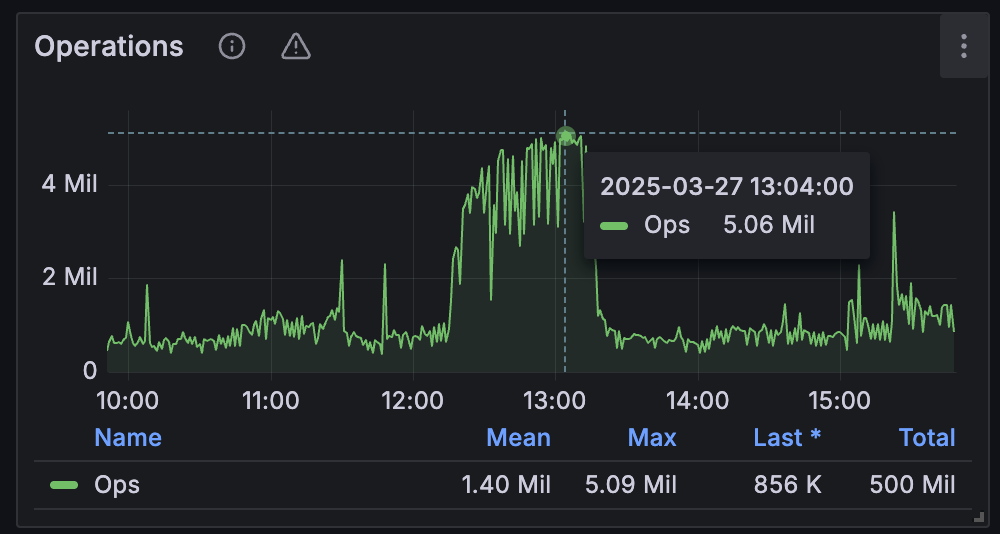
- Aggregate I/O throughput: 621 GB/s; aggregate IOPS: 5.06 million; the workload is read-heavy and dominated by large-block reads
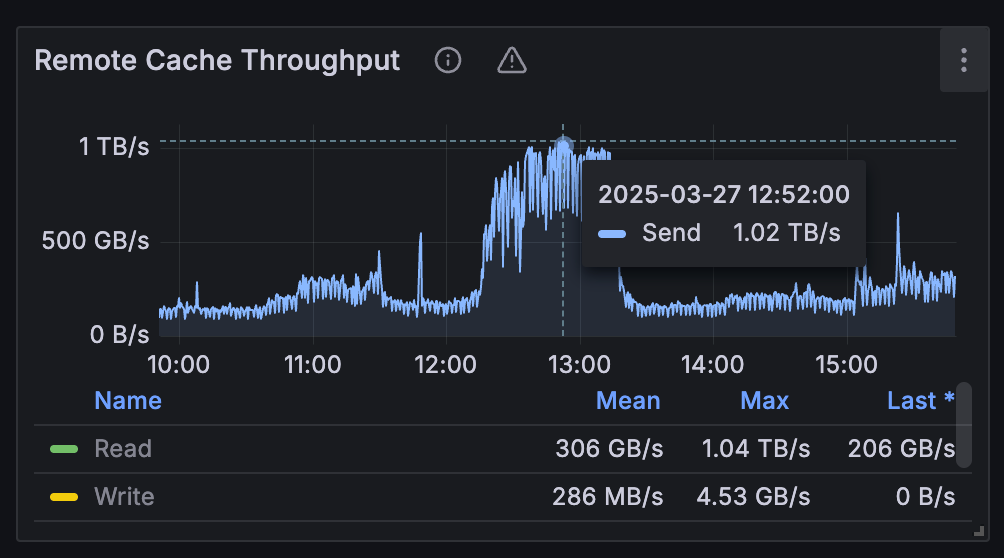
- Distributed cache outbound bandwidth: 1.02 TB/s
LLM training customer
This customer uses JuiceFS to support its entire LLM workflow, including pre-training and post-training workloads.
System scale
- Total data volume: 10+ PiB
- Number of files: 200+ million
- Average file size: 60 MiB
- Client nodes: 883
Key performance indicators
- Metadata QPS: up to 74,500/s, with an average response time of only 560 µs
- Aggregate read throughput: up to 186 GB/s, with an average of 6.15 GB/s
- Aggregate write throughput: up to 19.4 GB/s, with an average of 1.21 GB/s
- Distributed cache (remote cache) read throughput: up to 325 GB/s, with an average of 18.8 GB/s
AI model training customer
This customer primarily uses the JuiceFS distributed cache to accelerate model training. The cache cluster consists of 139 nodes, each providing 52 TB of cache capacity and a 40 Gbps IP NIC. The theoretical maximum throughput is 695 GB/s. The measured throughput nearly reached this limit:
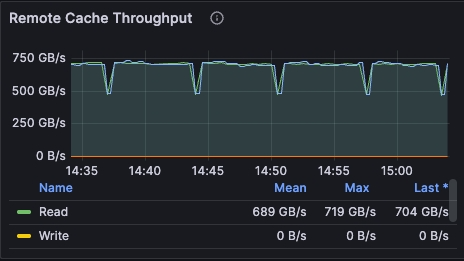
The preceding figure shows the aggregate throughput of cache clients reading from the cache pool.
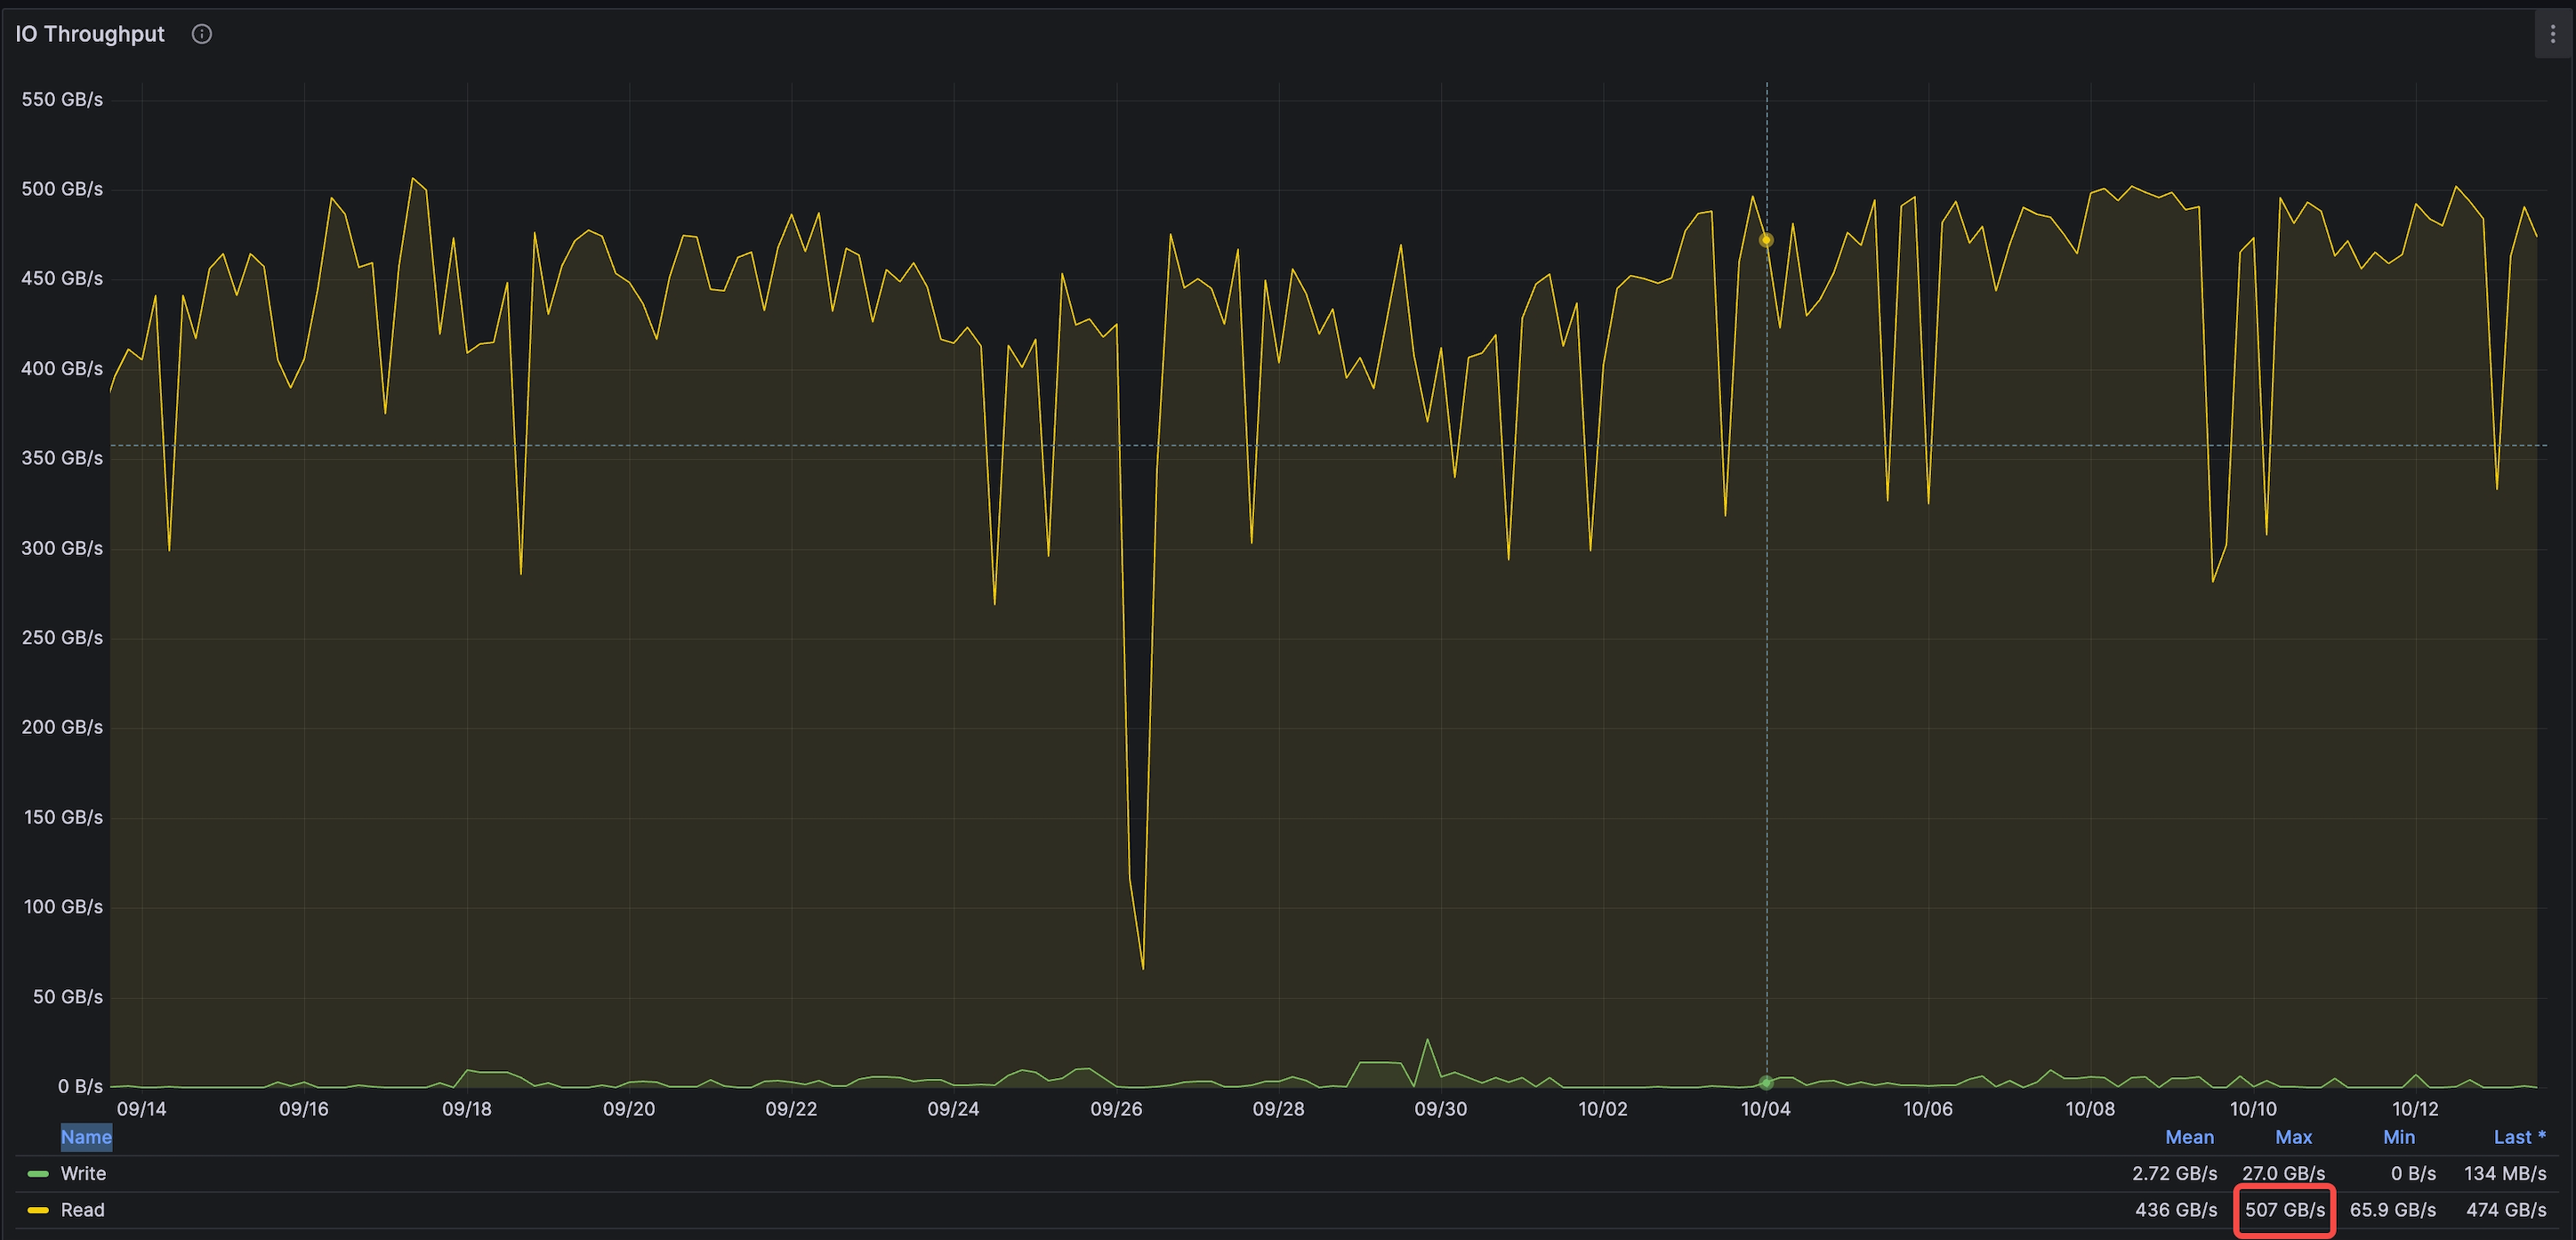
The preceding figure shows the throughput delivered to the actual application workload.
Because of intelligent readahead, outbound traffic from the cache cluster can be higher than the amount of useful data actually consumed by the application. This is expected when readahead hits occur. Compared with reading directly from object storage, cache read throughput increased by tens of times, significantly accelerating data access for model training and meeting the customer's expectations.