Monitoring and Data Visualization
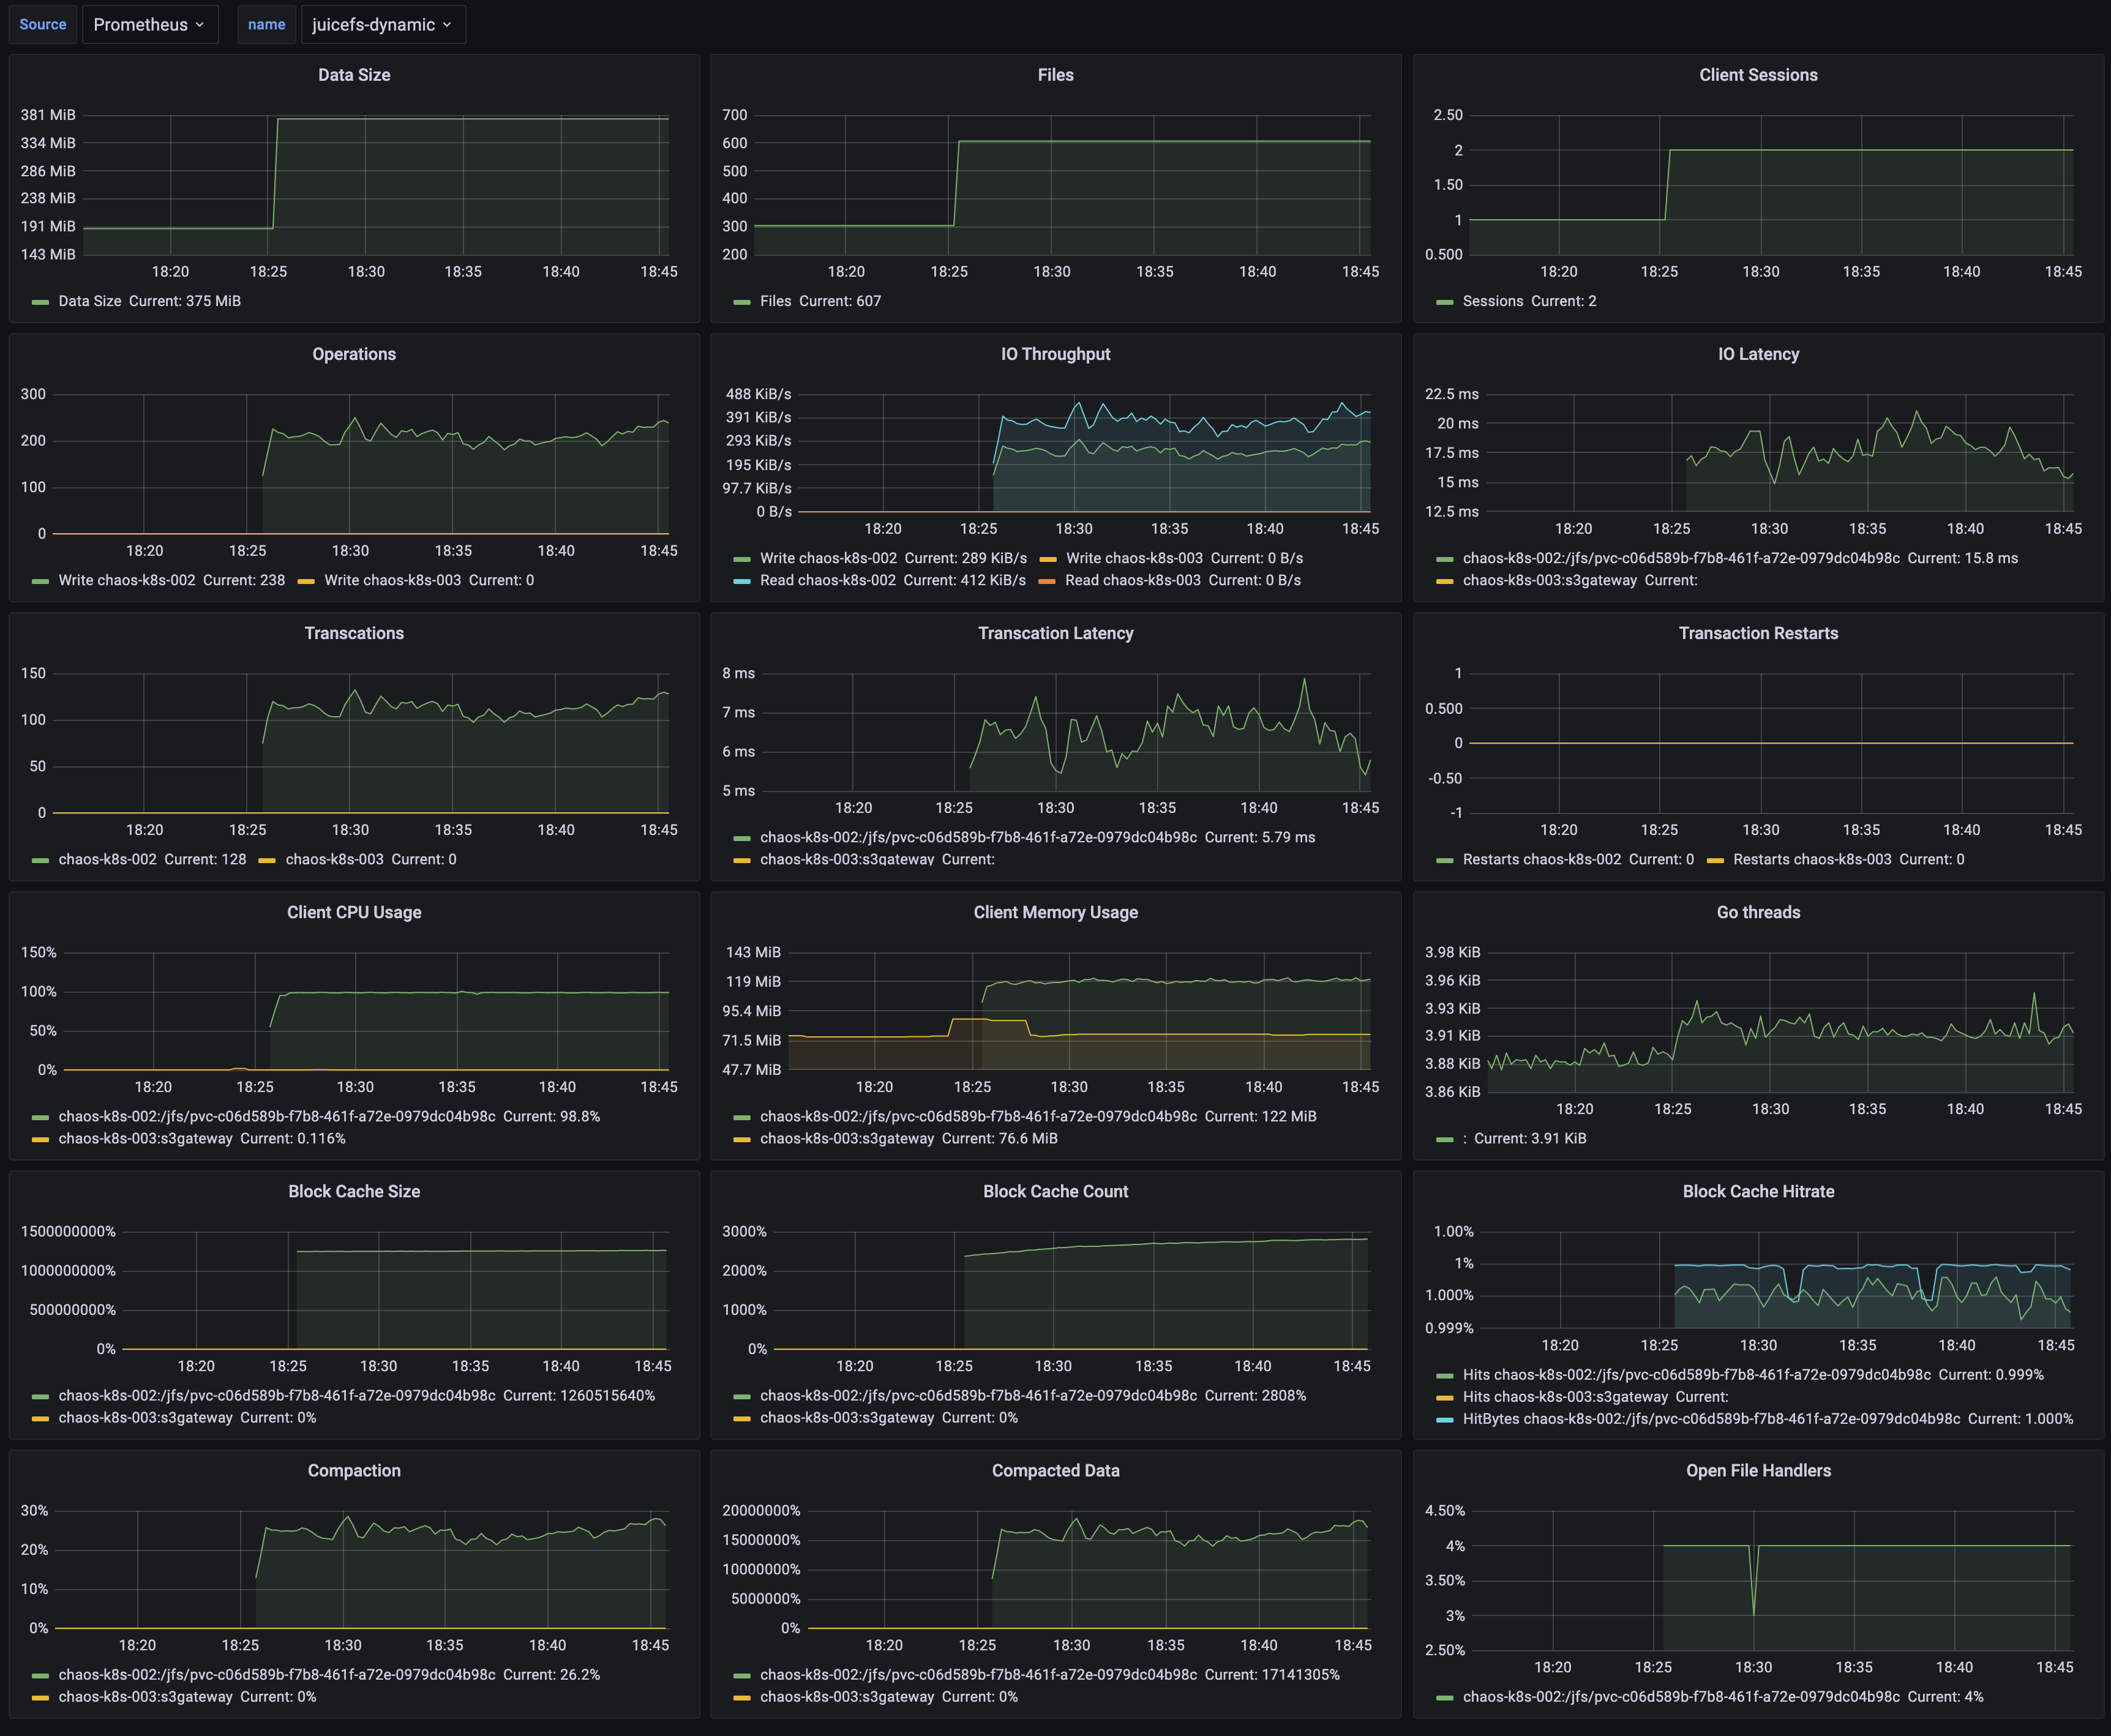
JuiceFS offers a suite of monitoring metrics, and this document outlines how to collect these metrics and visualize them with a monitoring system similar to the one depicted in the following image using Prometheus and Grafana.
The setup process is as follows:
- Configure Prometheus to scrape JuiceFS monitoring metrics.
- Configure Grafana to read the monitoring data from Prometheus.
- Use the official JuiceFS Grafana dashboard template to display the monitoring metrics.
This document uses open-source versions of Grafana and Prometheus for examples.
1. Configuring Prometheus to Scrape JuiceFS Monitoring Metrics
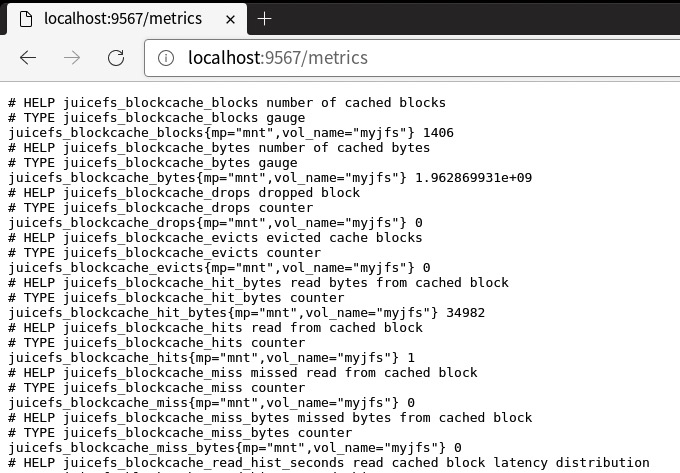
After mounting JuiceFS, it will automatically expose Prometheus-formatted metrics at http://localhost:9567/metrics. To observe the state changes of various metrics over a time range, you'll need to set up Prometheus and configure it to periodically scrape and save these metrics.
The process for collecting metrics may vary slightly depending on the mount method or access type (such as FUSE mount, CSI Driver, S3 Gateway, Hadoop SDK, etc.). For detailed instructions, see Collecting Monitoring metrics data.
For example, here's how you might configure Prometheus for a common FUSE mount: If you haven't already set up Prometheus, follow the official documentation.
Edit your prometheus.yml configuration file and add a new scrape configuration under scrape_configs. Define the JuiceFS client metrics address:
global:
  scrape_interval: 15s
  evaluation_interval: 15s

alerting:
  alertmanagers:
    - static_configs:
        - targets:
          # - alertmanager:9093

rule_files:
  # - "rules.yml"

scrape_configs:
  - job_name: "prometheus"
    static_configs:
      - targets: ["localhost:9090"]

  - job_name: "juicefs"
    static_configs:
      - targets: ["localhost:9567"]
Start the Prometheus service:
./prometheus --config.file=prometheus.yml
Visit http://localhost:9090 to see the Prometheus interface.
2. Configuring Grafana to Read from Prometheus
Once Prometheus begins scraping JuiceFS metrics, the next step is to set up Grafana to read from Prometheus.
If you haven't yet installed Grafana, follow the official documentation.
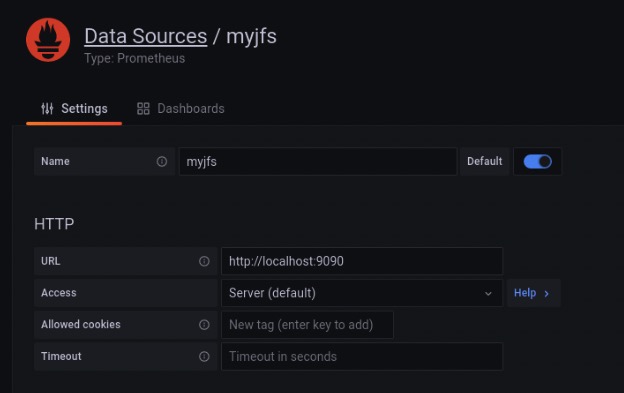
In Grafana, create a new data source of type Prometheus:
- Name: A name that helps you identify the data source, such as the name of the file system.
- URL: The Prometheus data API endpoint, typically
http://localhost:9090.
3. Using the Official JuiceFS Grafana Dashboard Template
JuiceFS's official Grafana dashboard templates can be found in the Grafana Dashboard repository and can be imported directly into Grafana via the URL https://grafana.com/grafana/dashboards/20794/ or by using the ID 20794.
Here's what the official JuiceFS Grafana dashboard might look like:
Collecting metrics data
For different types of JuiceFS Client, metrics data is handled slightly differently.
Mount point
When the JuiceFS file system is mounted via the juicefs mount command, you can collect monitoring metrics via the address http://localhost:9567/metrics, or you can customize it via the --metrics option. For example:
juicefs mount --metrics localhost:9567 ...
You can view these monitoring metrics using the command line tool:
curl http://localhost:9567/metrics
In addition, the root directory of each JuiceFS file system has a hidden file called .stats, through which you can also view monitoring metrics. For example (assuming here that the path to the mount point is /jfs):
cat /jfs/.stats
If you want to view the metrics in real-time, you can use the juicefs stats command.
Kubernetes
S3 Gateway
This feature needs to run JuiceFS client version 0.17.1 and above.
The JuiceFS S3 Gateway will provide monitoring metrics at the address http://localhost:9567/metrics by default, or you can customize it with the -metrics option. For example:
juicefs gateway --metrics localhost:9567 ...
If you are deploying JuiceFS S3 Gateway in Kubernetes, you can refer to the Prometheus configuration in the Kubernetes section to collect monitoring metrics (the difference is mainly in the regular expression for the label __meta_kubernetes_pod_label_app_kubernetes_io_name), e.g.:
scrape_configs:
  - job_name: 'juicefs-s3-gateway'
    kubernetes_sd_configs:
      - role: pod
    relabel_configs:
      - source_labels: [__meta_kubernetes_pod_label_app_kubernetes_io_name]
        action: keep
        regex: juicefs-s3-gateway
      - source_labels: [__address__]
        action: replace
        regex: ([^:]+)(:\d+)?
        replacement: $1:9567
        target_label: __address__
      - source_labels: [__meta_kubernetes_pod_node_name]
        target_label: node
        action: replace
Collected via Prometheus Operator
Prometheus Operator enables users to quickly deploy and manage Prometheus in Kubernetes. With the ServiceMonitor CRD provided by Prometheus Operator, scrape configuration can be automatically generated. For example (assuming that the Service of the JuiceFS S3 Gateway is deployed in the kube-system namespace):
apiVersion: monitoring.coreos.com/v1
kind: ServiceMonitor
metadata:
  name: juicefs-s3-gateway
spec:
  namespaceSelector:
    matchNames:
      - kube-system
  selector:
    matchLabels:
      app.kubernetes.io/name: juicefs-s3-gateway
  endpoints:
    - port: metrics
For more information on Prometheus Operator, please refer to the official documentation.
Hadoop Java SDK
JuiceFS Hadoop Java SDK supports reporting monitoring metrics to Pushgateway and Graphite.
Pushgateway
Report metrics to Pushgateway:
<property>
  <name>juicefs.push-gateway</name>
  <value>host:port</value>
</property>
At the same time, the frequency of reporting metrics can be modified through the juicefs.push-interval configuration. The default is to report once every 10 seconds.
According to the suggestion of Pushgateway official document, it is required to set honor_labels: true in the Prometheus's scrape configuration.
It is important to note that the timestamp of the metrics scraped by Prometheus from Pushgateway is not the time when the JuiceFS Hadoop Java SDK reported it, but the time when it scraped. For details, please refer to Pushgateway official document.
By default, Pushgateway will only save metrics in memory. If you need to persist metrics to disk, you can specify the file path for saving by the --persistence.file option and the frequency of saving to the file with the --persistence.interval option (by default, the metrics will be saved every 5 minutes).
Each process using JuiceFS Hadoop Java SDK will have a unique metric, and Pushgateway will always remember all the collected metrics. This may cause the continuous accumulation of metrics and taking up too much memory, and it will also make Prometheus scraping metrics slow. Therefore, it is recommended to clean up metrics on Pushgateway regularly.
For this, the following command can help. Clearing the metrics will not affect the running JuiceFS Hadoop Java SDK to continuously report data. Note that the --web.enable-admin-api option must be specified when Pushgateway is started, and the following command will clear all monitoring metrics in Pushgateway.
curl -X PUT http://host:9091/api/v1/admin/wipe
For more information about Pushgateway, please check official document.
Graphite
Report metrics to Graphite:
<property>
  <name>juicefs.push-graphite</name>
  <value>host:port</value>
</property>
At the same time, the frequency of reporting metrics can be modified through the juicefs.push-interval configuration. The default is to report every 10 seconds.
For all configurations supported by JuiceFS Hadoop Java SDK, please refer to documentation.
Use Consul as registration center
This feature needs to run JuiceFS client version 1.0.0 and above.
JuiceFS support to use Consul as registration center for metrics API. The default Consul address is 127.0.0.1:8500. You could customize the address through --consul option, e.g.:
juicefs mount --consul 1.2.3.4:8500 ...
When the Consul address is configured, the configuration of the --metrics option is not needed, and JuiceFS will automatically configure metrics URL according to its own network and port conditions. If --metrics is set at the same time, it will first try to listen on the configured metrics URL.
For each service registered to Consul, the service name is always juicefs, and the format of service ID is <IP>:<mount-point>, for example: 127.0.0.1:/tmp/jfs.
The meta of each service contains two keys hostname and mountpoint, the corresponding values represent the host name and path of the mount point respectively. In particular, the mountpoint value for the S3 Gateway is always s3gateway.
After successfully registering with Consul, you need to add a new consul_sd_config configuration to prometheus.yml and fill in the services with juicefs.
Monitoring metrics reference
Refer to JuiceFS Metrics.

