


After deployment, JuiceFS feels like a local drive, but underneath it's a sophisticated distributed system. This perfectly reflects one of its core design principles: distributed systems are complex, but from a user's perspective, they should be simple to use.
Even so, that simplicity on the surface doesn't negate the need for deep visibility. For any critical storage system, gaining real-time visibility into its operations is crucial to prevent subtle performance degradations from escalating into significant incidents.
Fortunately, JuiceFS exposes a suite of monitoring metrics, including throughput, IOPS, latency, data size, and many more, in the widely adopted Prometheus format, making it ready for modern monitoring stacks. Traditionally, you would probably pair Prometheus with Grafana to collect these metrics and visualize them. This is indeed a powerful combination. However, deploying, managing, and maintaining these systems yourself adds operational overhead again. Ironically, you may want to monitor them too, and trust me, you would rather not create yet another monitoring stack just to monitor your Prometheus and Grafana combo.
That's where Better Stack comes in. It is a fully managed SaaS observability platform that combines user-friendly dashboards, tracing, logging, error tracking, incident management, automatic alerting, and even AI-powered SRE, all for a predictable, cost-effective price. With Better Stack, you get the power of the best-in-class tools out of the box without the operational overhead.
In this post, we'll guide you through setting up a comprehensive monitoring system for JuiceFS using Better Stack, from metric ingestion to intelligent alerting, so you can ensure your file system remains healthy and performant.
Preparing the JuiceFS file system
Before diving into setting up Better Stack for monitoring, you'll need an existing JuiceFS file system that is actively publishing metrics. JuiceFS Community Edition and JuiceFS Enterprise Edition (our cloud service is based on JuiceFS Enterprise Edition) both expose real-time status metrics in Prometheus format, but they do it in slightly different ways.
For the JuiceFS Community Edition, after mounting the file system, JuiceFS automatically exposes metrics via http://localhost:9567/metrics by default on the mounting host where the JuiceFS client is running. You can customize this port using the --metrics option if needed.
On the other hand, for JuiceFS Enterprise Edition & Cloud Service, metrics are exposed through the console via dedicated API endpoints. You'll need to replace VOLUME_NAME with your file system name and API_TOKEN with your API token. In this case, both Prometheus and JSON formats are available for metrics:
-
Prometheus:
https://juicefs.com/api/vol/VOLUME_NAME/metrics?token=API_TOKEN -
JSON:
https://juicefs.com/api/volume/VOLUME_NAME/status?token=YOUR_TOKEN
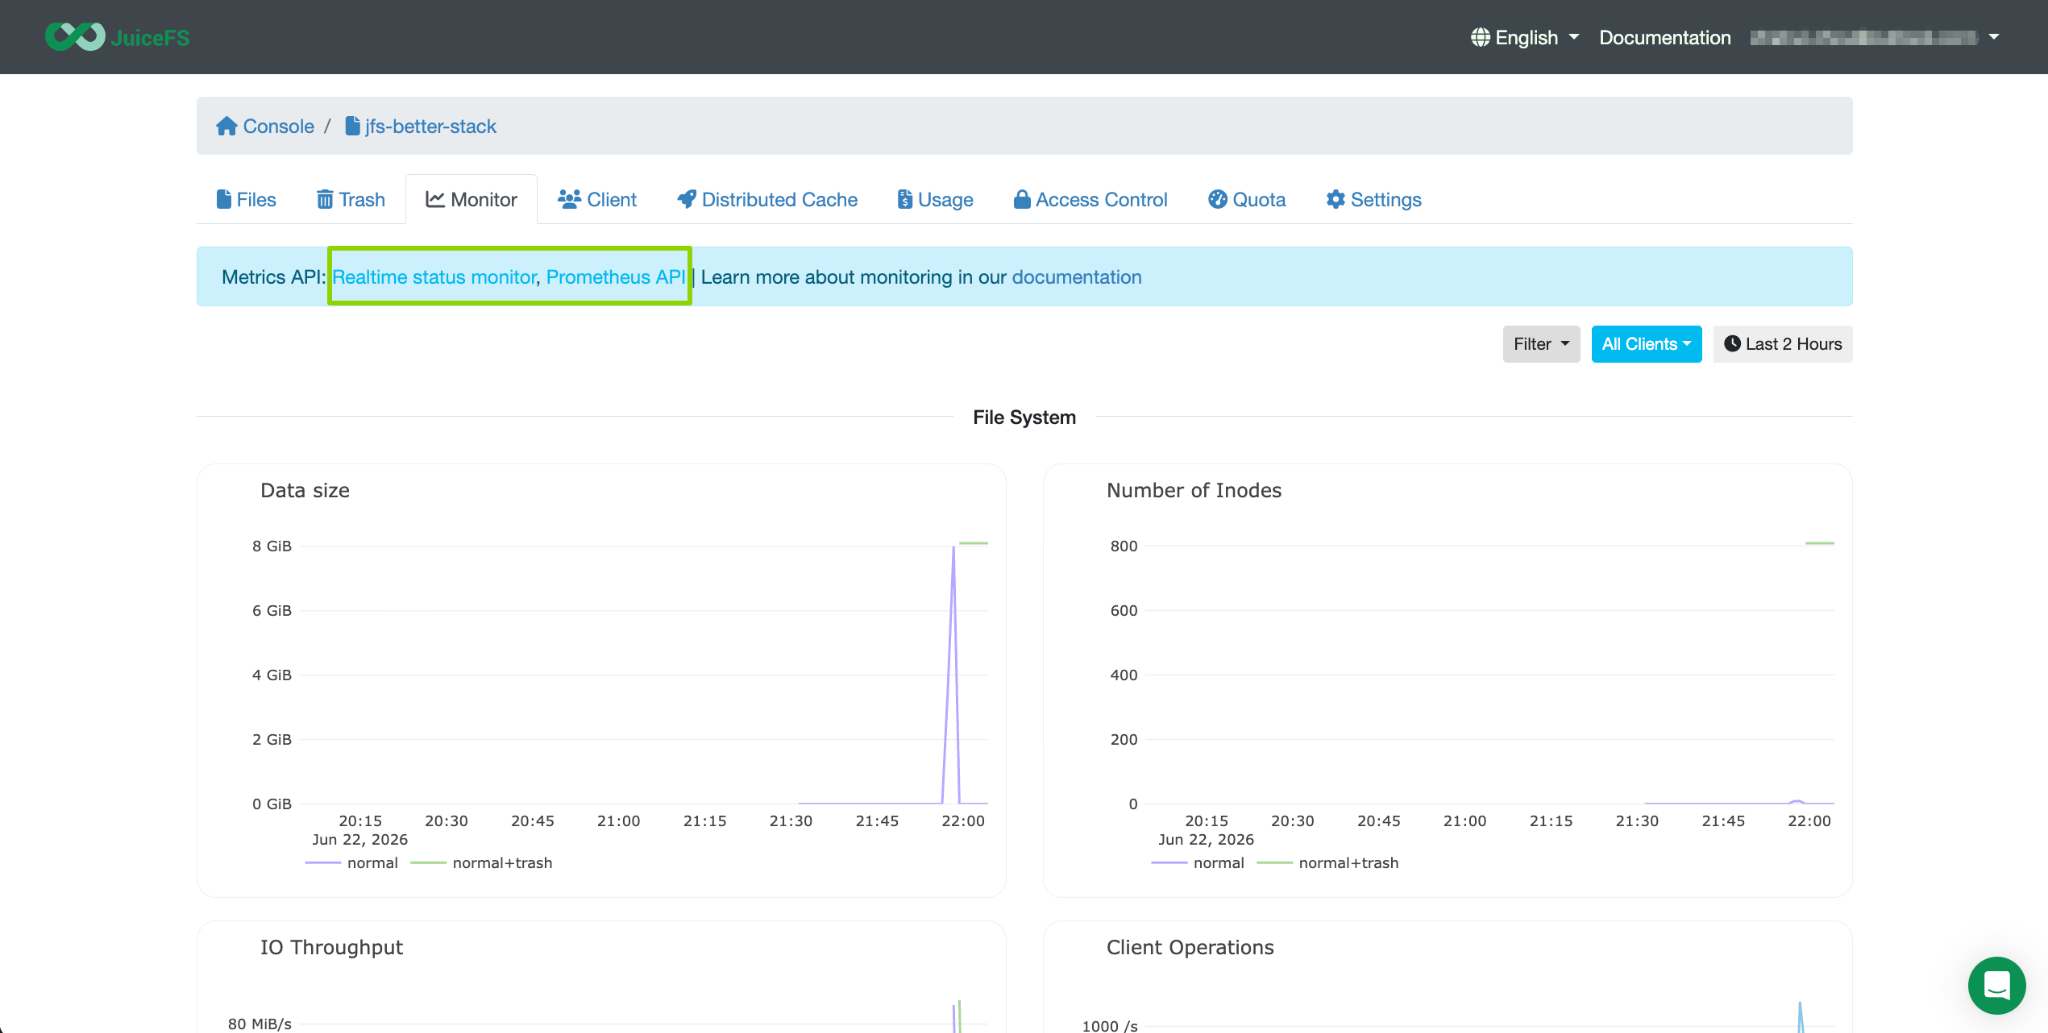
A quick but important note: metrics are only generated when the file system is mounted. So before proceeding, ensure your JuiceFS file system is properly mounted and accessible. In this guide, we will use the JuiceFS Cloud Service, as it's the simplest to get started. If you haven't set up JuiceFS yet, please refer to the documentation for detailed instructions. Once you have created the first file system, URLs for the metrics mentioned above would be available under its Monitor tab.
Setting up a metrics source in Better Stack
With your JuiceFS file system up and running (don't forget to mount the file system to a host machine) and publishing metrics, the next step is to configure Better Stack to start ingesting that data.
First, if you haven't already, register for a Better Stack account. The process is seamless. Using a work email is recommended, and the platform provides clear guidance to help you set up your account and organization.
Once you're logged in, follow these steps:
-
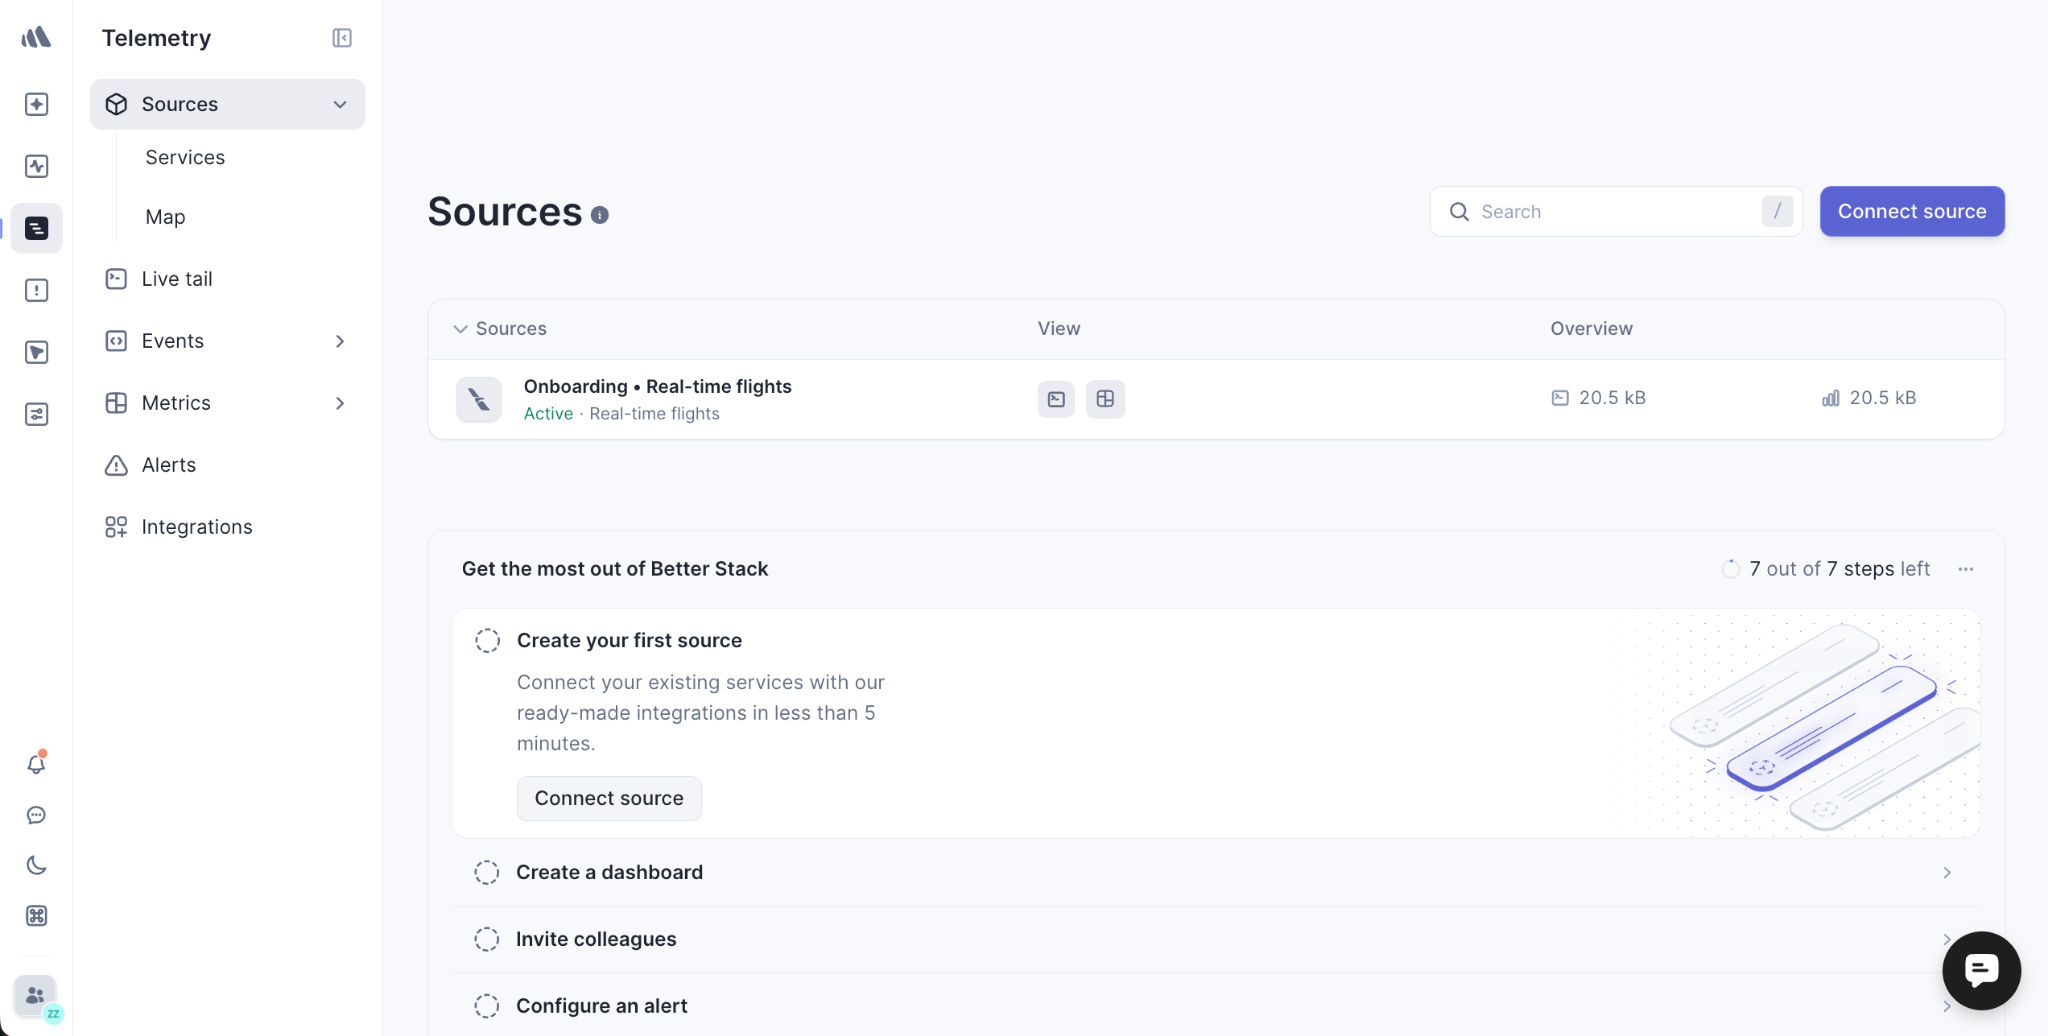
In the left-hand navigation panel, head to Telemetry.
-
Under the Sources section, click Connect source.
-
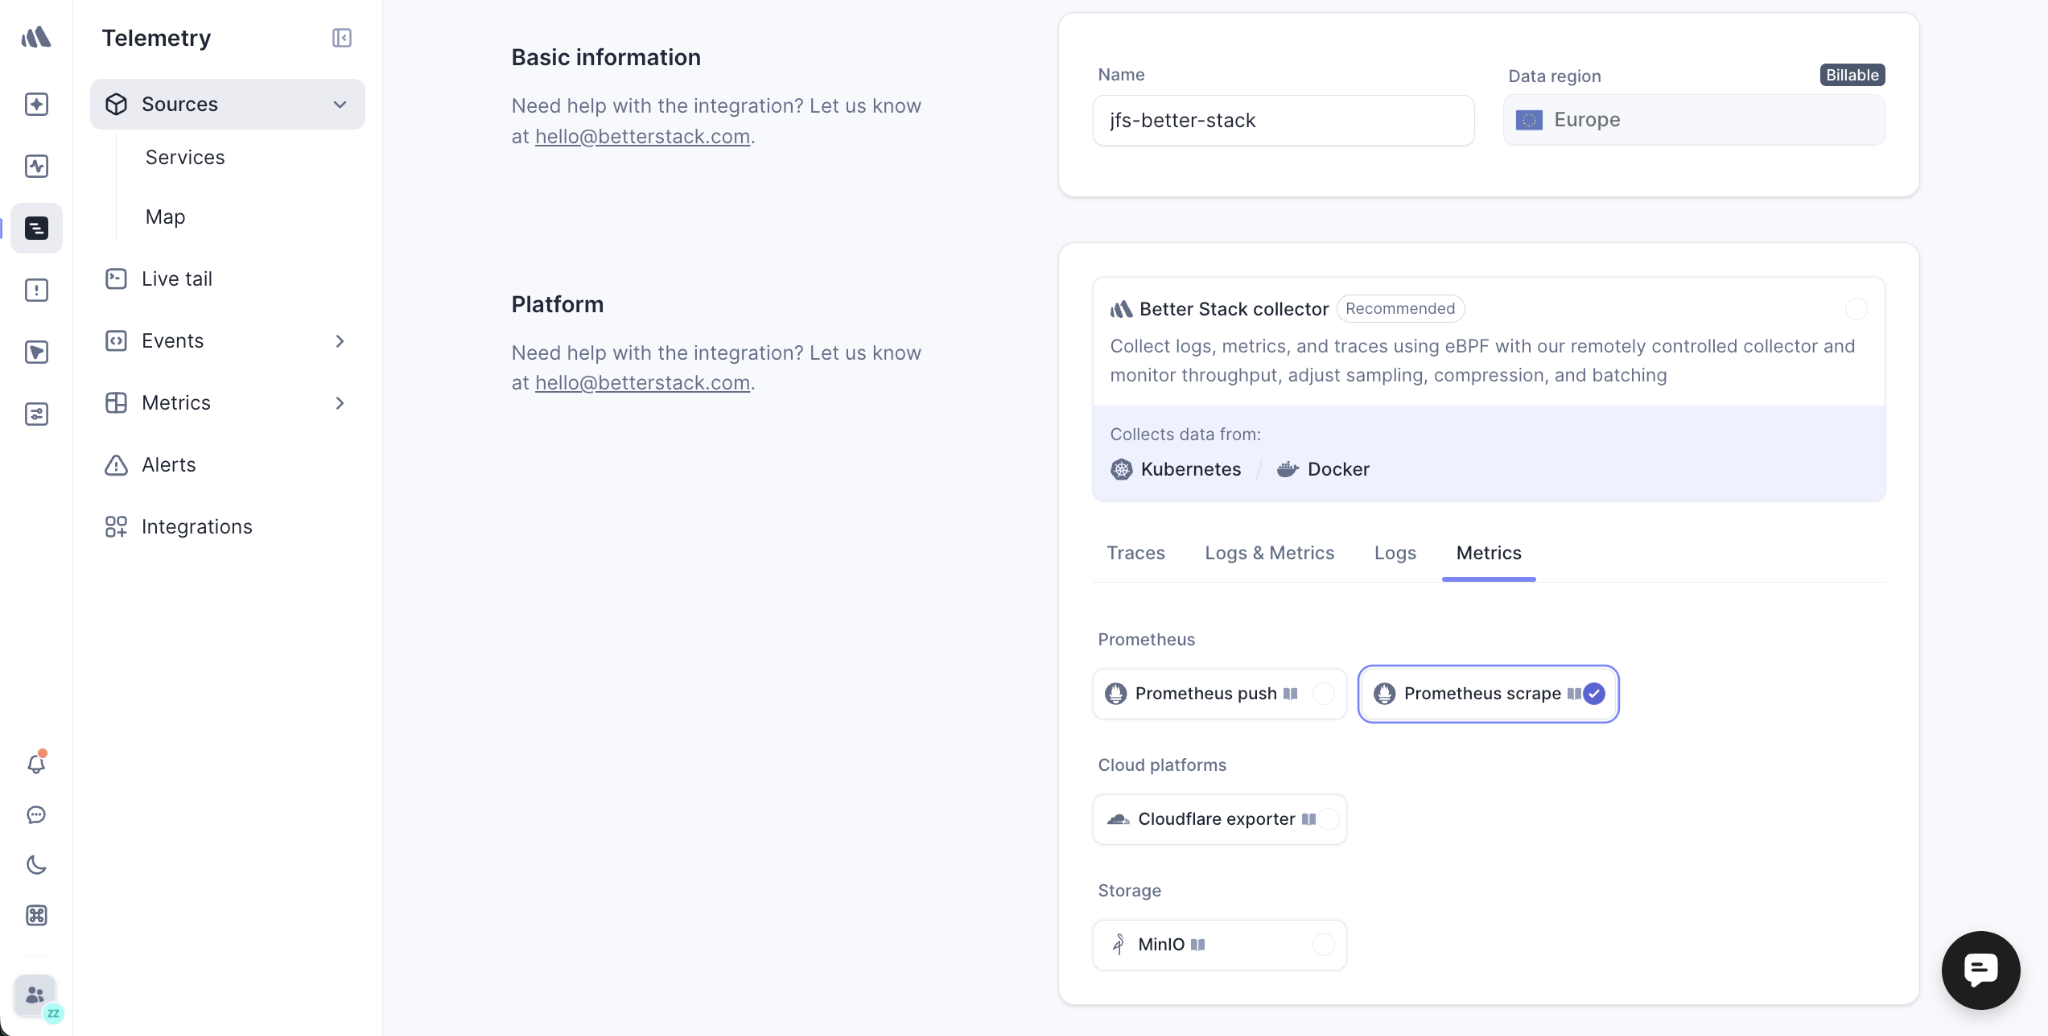
Give your telemetry data source a descriptive name, such as "jfs-better-stack" or "juicefs-production", to easily identify it later.
Now, you'll configure how Better Stack should collect your metrics. In the collector settings:
-
Under Metrics, choose the Prometheus scrape option and click Connect source.
-
In the URLs to scrape section, input the JuiceFS metrics endpoint as described above.
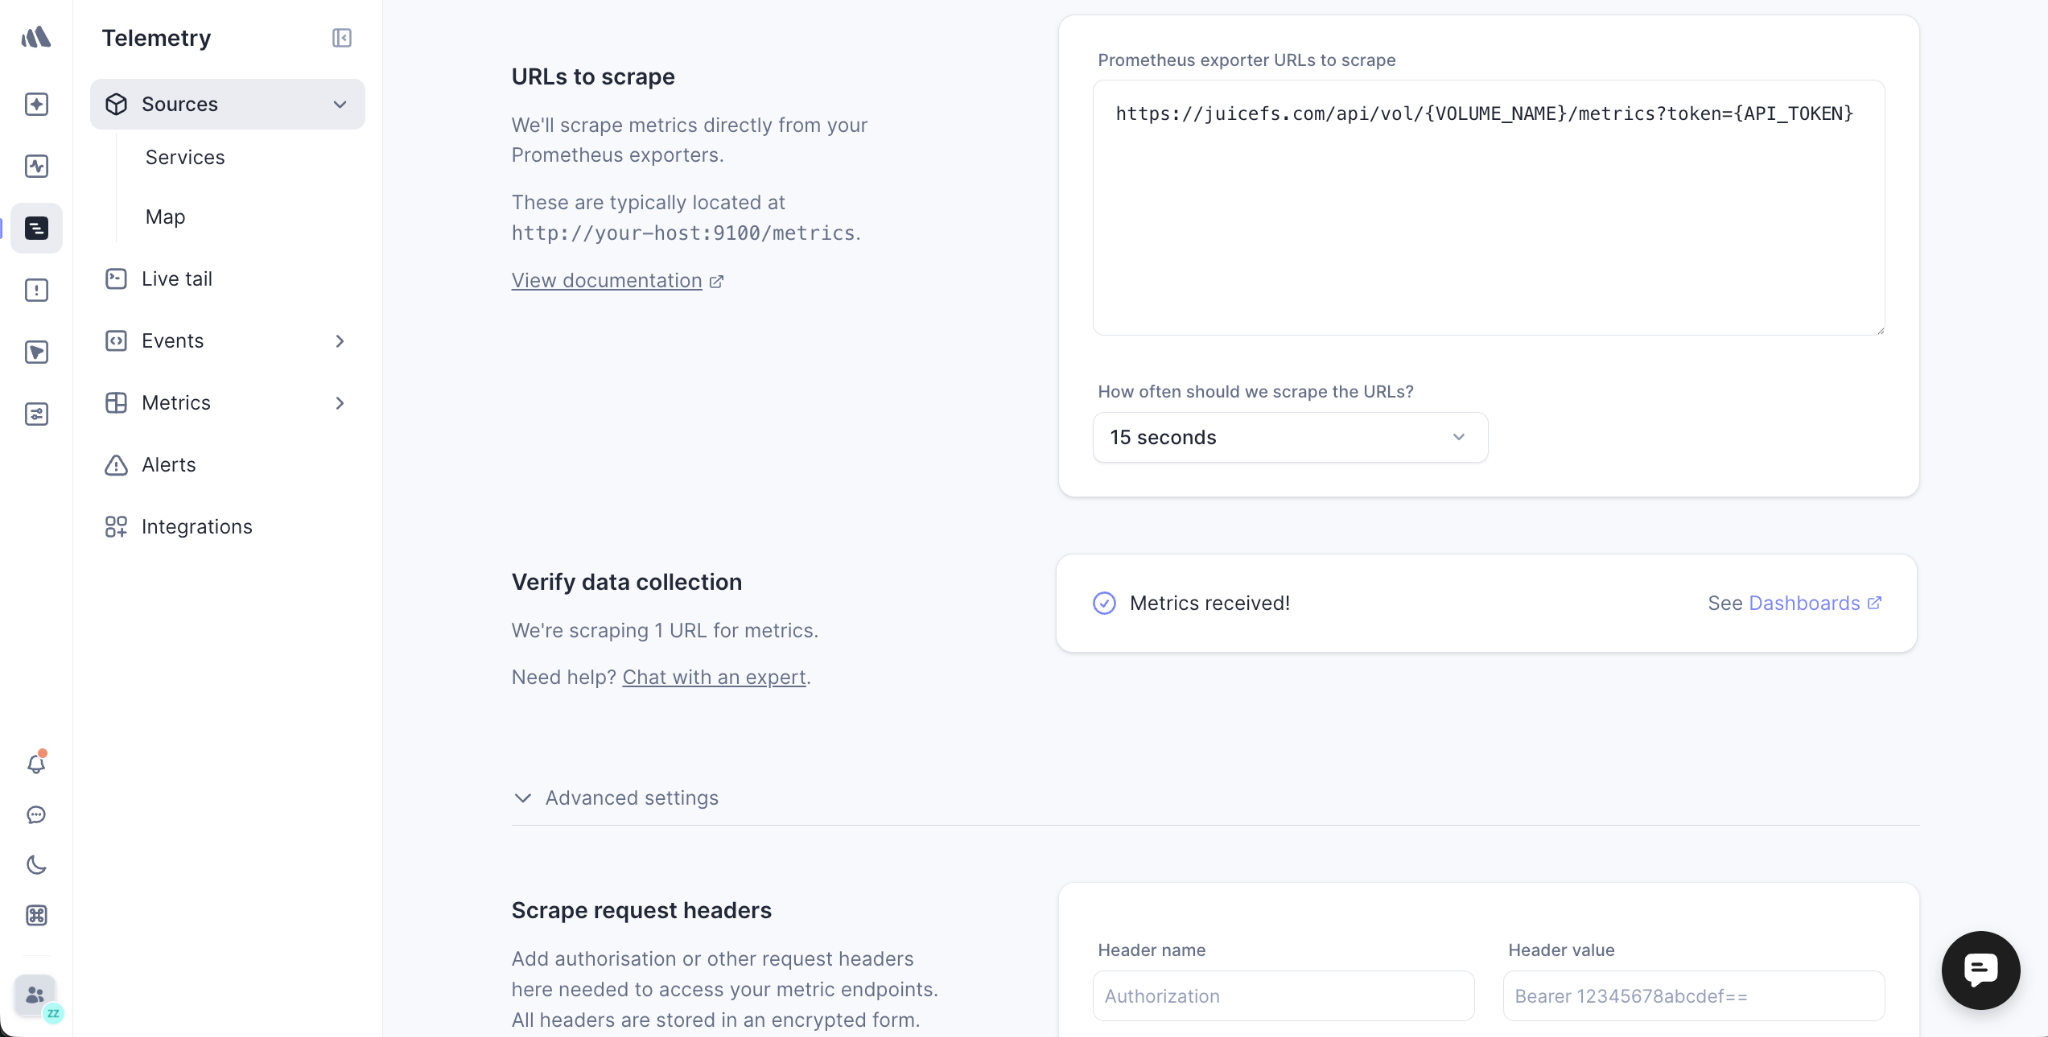
Note that if you are not using the JuiceFS Cloud Service and your JuiceFS endpoint is behind a firewall, you'll need to allow traffic from Better Stack's scrape servers. The list of IP addresses to add to the allowlist is available in their documentation and from here.
After saving the configuration, Better Stack will begin scraping the endpoint. Your JuiceFS metrics should be received within a few seconds.
Creating a dashboard with AI SRE
With your JuiceFS metrics flowing into Better Stack, it's time to visualize them. You could build a dashboard manually, but Better Stack provides a smarter and more efficient way to do it by using AI SRE.
What is AI SRE?
AI SRE (Site Reliability Engineering) is Better Stack's chat-based site reliability assistant. It's an autonomous AI agent that can read your telemetry data, analyze incidents, build dashboards, and even write code to fix errors. Instead of waiting for humans to manually set up charts and queries, AI SRE can generate comprehensive dashboards for you based on a prompt.
It's notable that AI SRE is a paid feature. If you're on the free plan, you can still create dashboards manually using the drag-and-drop chart builder.
Creating a JuiceFS monitoring dashboard with a single prompt
Once your metrics source is ready, follow these steps:
-
From the left panel, head to Telemetry and then Metrics.
-
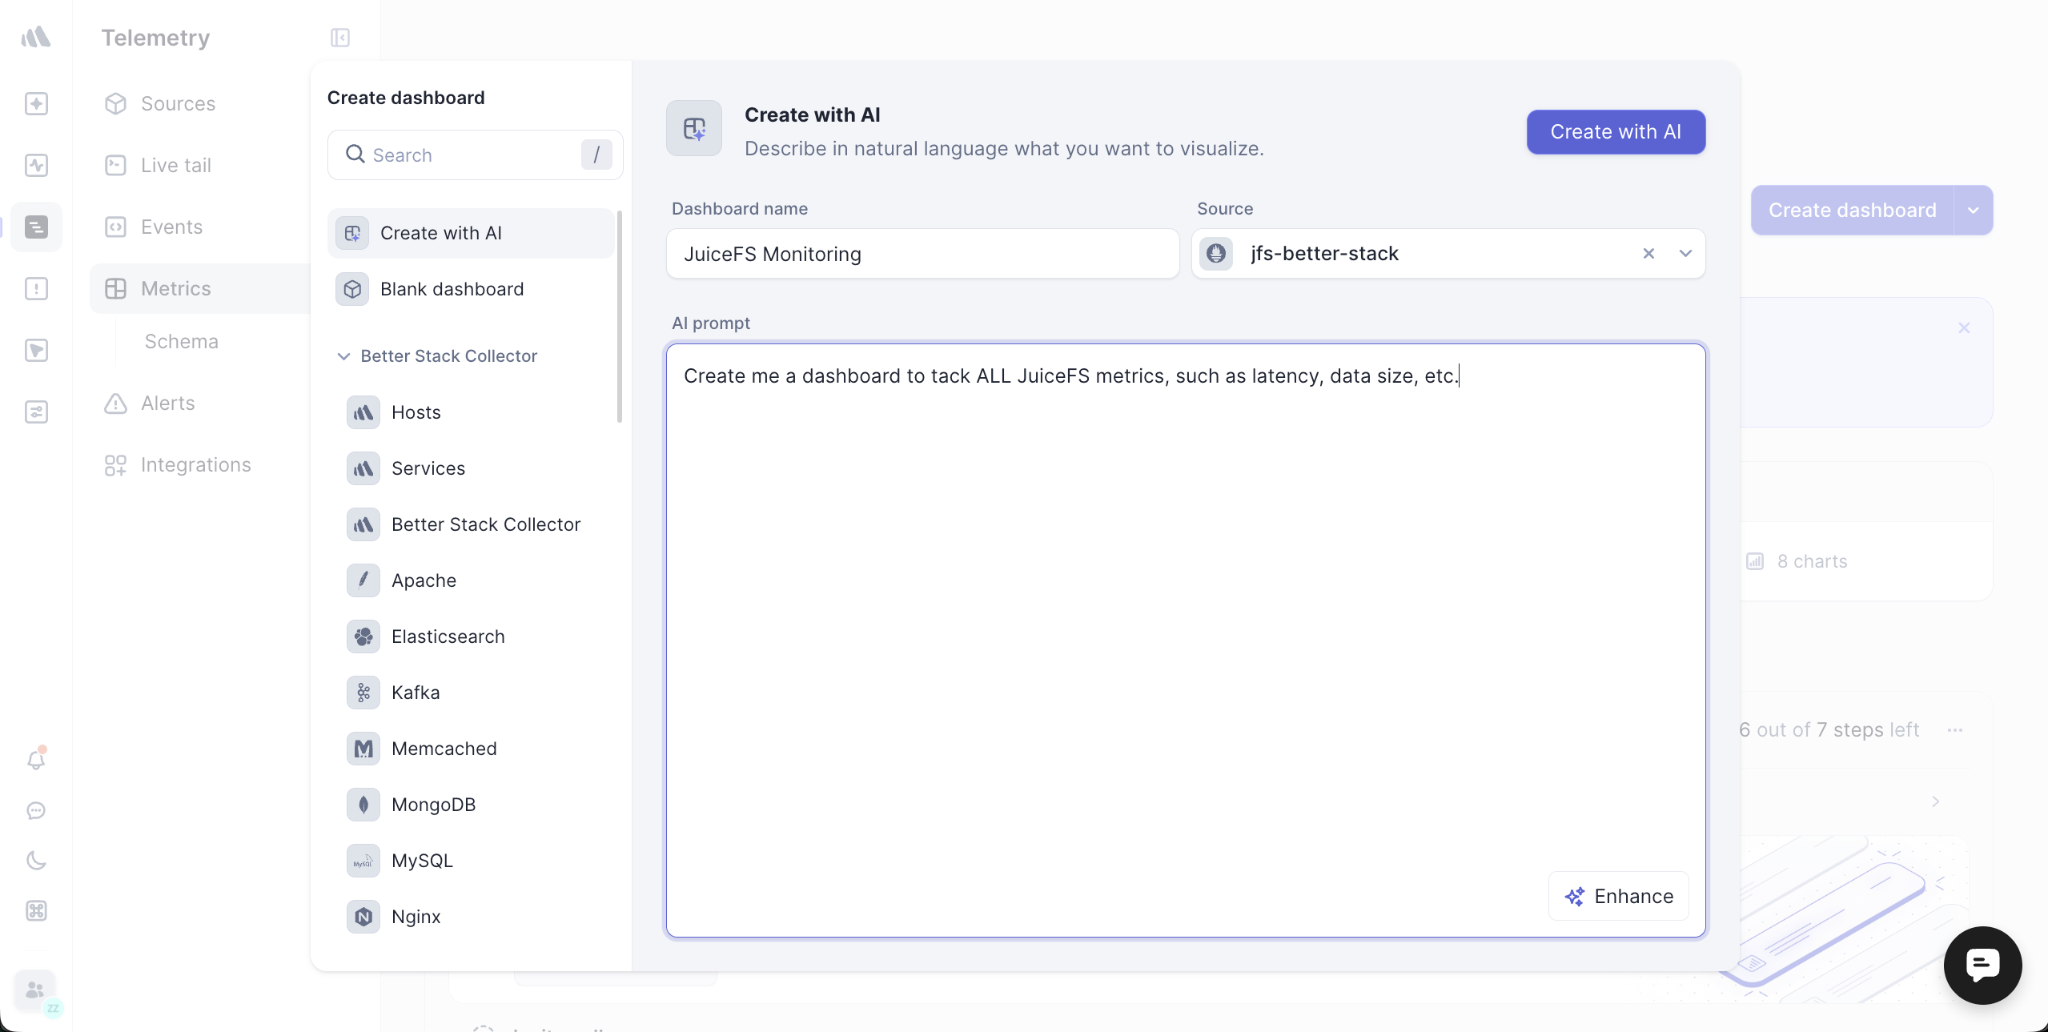
Click Create dashboard and select the Create with AI option.
-
In the prompt field, give AI SRE a clear description of what you need. For example: "Create me a dashboard to track ALL JuiceFS metrics, such as latency, data size, etc."
-
Also make sure to select the metrics Source you created earlier (for example, "jfs-better-stack") so that AI SRE has the proper context and data to work with.
Give the platform a few minutes for the dashboard to be created. AI SRE will analyze your JuiceFS metrics and automatically generate a complete set of charts and panels for the important performance indicators such as throughput, IOPS, latency, and storage utilization. For my first time trying this, it just worked like a charm as shown below.
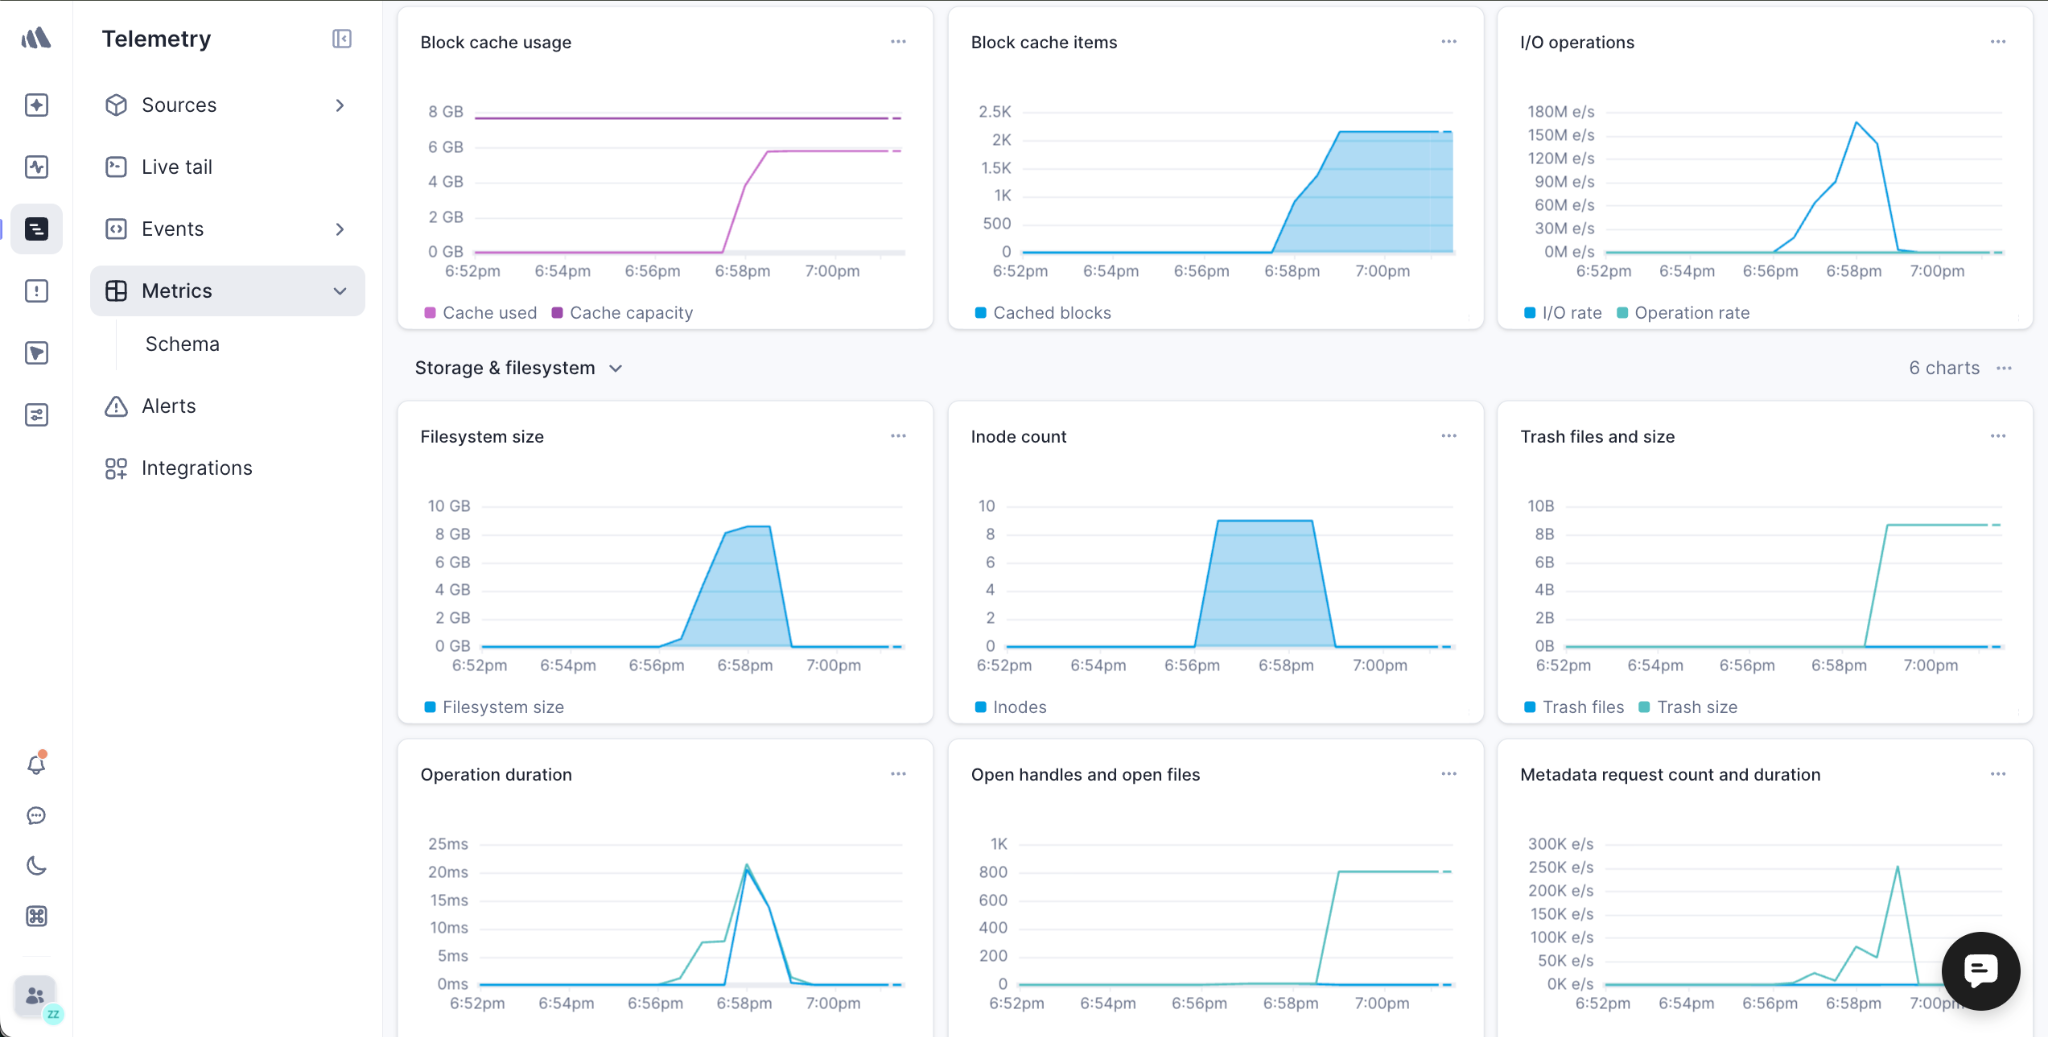
AI SRE is a powerful feature that does so much more than create dashboards. It can analyze incidents, perform root cause analysis, suggest fixes, and even open pull requests. We've only scratched the surface in this post. This is your first step toward a smarter, AI-assisted observability workflow. After building your dashboard, you can further customize it by adding panels, editing queries, or setting alerts directly from the graphs.
Conclusion
In this post, we have walked through how to build a complete observability system for JuiceFS with Better Stack. We started by setting up the JuiceFS file system and getting its Prometheus-formatted metrics, then created a metrics source in Better Stack to ingest the data. We examined rapid creation of a full dashboard with AI SRE.
We hope this guide helps you gain better visibility into your JuiceFS deployment. If you have any questions or run into issues, we'd love to hear from you. Join the JuiceFS community on GitHub or Discord. And don't forget to check out Better Stack's documentation and their amazing YouTube channel for practical insights about distributed file storage, observability, AI, and more.