


Due to the complexity of Kubernetes environments and architectures, monitoring and troubleshooting various issues are essential during practical usage. Therefore, we need more intuitive means to examine the configurations, statuses, logs, and relationships among different components. To address this need, JuiceFS CSI Driver 0.23.0 introduced a dashboard, providing users with a centralized monitoring and management interface. This improvement will help users diagnose and resolve issues more easily, enhancing overall availability and maintainability.
In this post, we’ll deep dive into JuiceFS CSI Driver’s architecture, the limitations in conventional troubleshooting of JuiceFS CSI Driver, the installation and features of JuiceFS CSI Dashboard, and our future plans.
JuiceFS CSI Driver’s architecture
JuiceFS CSI Driver adheres to the CSI specification, implementing the interface between container orchestration systems and the JuiceFS file system. In Kubernetes, JuiceFS can be provided to pods in the form of PersistentVolumes (PVs). The typical components of JuiceFS CSI Driver include:
- JuiceFS CSI Controller (StatefulSet)
- JuiceFS CSI Node Service (DaemonSet)
You can view the components using kubectl:
$ kubectl -n kube-system get pod -l app.kubernetes.io/name=juicefs-csi-driver
NAME                       READY   STATUS        RESTARTS   AGE
juicefs-csi-controller-0   2/2     Running       0          141d
juicefs-csi-node-8rd96     3/3     Running       0          141d
JuiceFS CSI Driver runs in the container mount (mount pod) mode by default, meaning the JuiceFS client runs in independent pods. The architecture is as follows:

When there are actively used JuiceFS PVs in the Kubernetes cluster, you can view the mount pods that are providing services:
$ kubectl -n kube-system get pod -l app.kubernetes.io/name=juicefs-mount
NAME                                                               READY   STATUS    RESTARTS      AGE
juicefs-minikube-pvc-883d8aef-691c-49af-b9dc-bbe8f57b1e36-ilenem   1/1     Running   1 (14d ago)   14d
juicefs-minikube-pvc-9a37fd2c-54ac-441a-8498-6c7622a1ef6b-cnojjs   1/1     Running   0             14d
Limitations in conventional JuiceFS CSI Driver troubleshooting
While the CSI specification provides powerful cloud-based data management capabilities, the highly abstracted interfaces and decentralized deployment of system components pose significant challenges for troubleshooting. Typically, kubectl or Kubernetes' built-in dashboard is used for CSI driver-related issue troubleshooting. However, these tools, apart from resource charts, offer similar functionalities. Here, we demonstrate the troubleshooting steps using kubectl.
Basic usage of kubectl
kubectl is a powerful Kubernetes command-line client with features for deploying applications, monitoring and managing cluster resources, and viewing events and logs. Here are some basic usage examples:
- List pods:
$ kubectl get po                           # List pods in the default namespace.
$ kubectl get po -n kube-system # List pods in a specific namespace.
$ kubectl get po -A                      # List all pods.
- Find a specific pod:
$ kubectl get po juicefs-csi-node-xy7sa                       # Exact name lookup
$ kubectl get po -l app=juicefs                                     # Label filtering
$ kubectl get po --field-selector spec.nodeName=n1  # Field-based lookup
- Describe pod status:
    $ kubectl describe po juicefs-csi-node-xy7sa
…
- View pod logs:
$ kubectl logs po juicefs-csi-node-xy7sa
$ kubectl logs -f po juicefs-csi-node-xy7sa # View and monitor log updates.
Find the mount pod corresponding to an application pod
If an application pod remains in the ContainerCreating state or experiences JuiceFS file read/write errors while running normally, you must promptly check the mount pod providing the service.
Assuming the application pod is named default/dynamic-ce, perform the following steps to find the path to the corresponding mount pod using kubectl:
$ kubectl describe po dynamic-ce | grep -A 5 Annotations
Annotations:
    juicefs-mountpod-pvc-bffb9986-8433-4591-b86e-1f7fbb61d48e: kube-system/juicefs-minikube-pvc-bffb9986-8433-4591-b86e-1f7fbb61d48e-bodwcu
...
$ kubectl logs -n kube-system juicefs-minikube-pvc-bffb9986-8433-4591-b86e-1f7fbb61d48e-bodwcu
...
Find the CSI Node pod corresponding to an application pod
If an application pod encounters problems, and you cannot locate the mount pod, you must check the CSI Node pod to confirm the reasons for mount pod creation failure or unexpected deletion.
Perform the following steps to find the path to the CSI Node pod using kubectl:
$ kubectl describe po dynamic-ce | grep Node:
Node:             minikube/192.168.39.29
$ kubectl get -n kube-system po -l app=juicefs-csi-node --field-selector spec.nodeName=minikube
NAME                     READY   STATUS    RESTARTS   AGE
juicefs-csi-node-bltwt   3/3     Running   0          141m
$ kubectl logs -n kube-system juicefs-csi-node-bltwt
...
Trace application pods based on mount pods
When you find a mount pod has a problem, you may need to determine the extent of the failure and restart affected application pods. Assuming the mount pod is kube-system/juicefs-minikube-pvc-bffb9986-8433-4591-b86e-1f7fbb61d48e-bodwcu, you can perform the following steps to find the corresponding application pod:
$ kubectl describe po -n kube-system juicefs-minikube-pvc-bffb9986-8433-4591-b86e-1f7fbb61d48e-bodwcu | grep -A 5 Annotations
Annotations:
    juicefs-a61a8333c4cf3b2337faa3eeaff326a3d7c9fee00879c314cf6b157: /var/lib/kubelet/pods/e50fef20-8479-4eab-bf1c-d423efdec35a/volumes/kubernetes.io~csi/pvc-bffb9986-8433-4591-b86e-1f7fbb61d48e/mount
$ kubectl get po -A -o json | jq -r '.items[] | select(.metadata.uid=="e50fef20-8479-4eab-bf1c-d423efdec35a") | .metadata.namespace + "/" + .metadata.name '
default/dynamic-ce-7c5d795bb-g8dvj
$ kubectl describe po dynamic-ce-7c5d795bb-g8dvj
...
While these troubleshooting steps may not seem complex individually, the combination and repetition of these steps for multiple resources can decrease efficiency. Moreover, these steps may vary with different versions, demanding a high level of proficiency from operators.
Installation and features of JuiceFS CSI Dashboard
To simplify the troubleshooting process for JuiceFS CSI, we’ve developed the JuiceFS CSI Dashboard.
Installation
The dashboard feature is released in JuiceFS CSI v0.23.0 (Helm chart v0.19.1). We recommend using Helm for installation:
$ helm repo add juicefs https://juicedata.github.io/charts/
$ helm repo update
$ helm search repo juicefs
NAME                            CHART VERSION   APP VERSION     DESCRIPTION
juicefs/juicefs-csi-driver      0.19.1          0.23.1          A Helm chart for JuiceFS CSI Driver
juicefs/juicefs-s3-gateway      0.11.2          1.6.0           A Helm chart for JuiceFS S3 Gateway
$ helm install juicefs-csi-driver juicefs/juicefs-csi-driver \
    -n kube-system \
    --set dashboard.hostNetwork=true \
    --set dashboard.replicas=1 \
    --set dashboard.leaderElection.enabled=false
...
$ kubectl get po -n kube-system -l app.kubernetes.io/name=juicefs-csi-driver
NAME                                   READY   STATUS    RESTARTS   AGE
juicefs-csi-controller-0               4/4     Running   0          10s
juicefs-csi-controller-1               4/4     Running   0          10s
juicefs-csi-dashboard-9b546556-wltt8   1/1     Running   0          10s
juicefs-csi-node-bltwt                 3/3     Running   0          10s
When all the pods above are in the READY state, it means that the JuiceFS CSI Driver installation with the Dashboard component was successful.
Features overview
After you follow the installation steps mentioned earlier, using the hostNetwork approach, you can access JuiceFS CSI Dashboard either through http://localhost:8088 or by using the kubectl port-forward tool to access the service inside the pod:
$ kubectl port-forward -n kube-system juicefs-csi-dashboard-9b546556-t569z 8088:8088
Forwarding from 127.0.0.1:8088 -> 8088
Forwarding from [::1]:8088 -> 8088
Open http://localhost:8088 in your browser. By default, you can see a list of all application pods using JuiceFS CSI. The displayed information includes pod names, namespaces, JuiceFS PV in use, mount pods providing services, status, creation time, and the associated CSI Node.
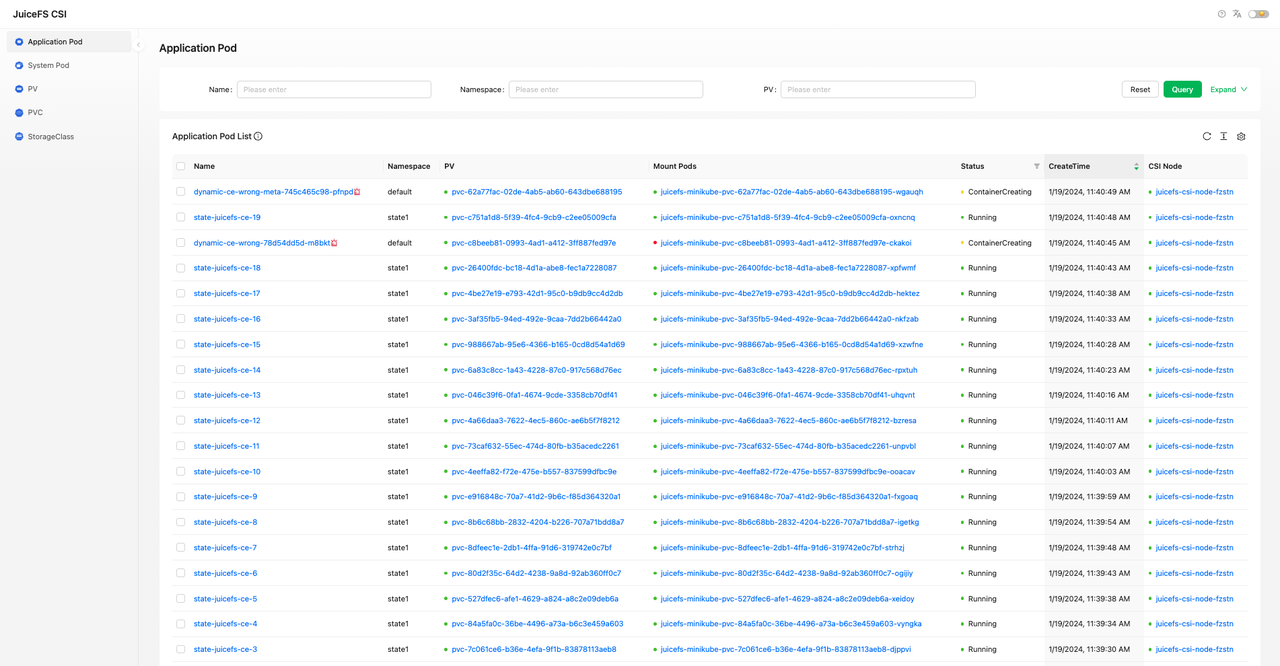
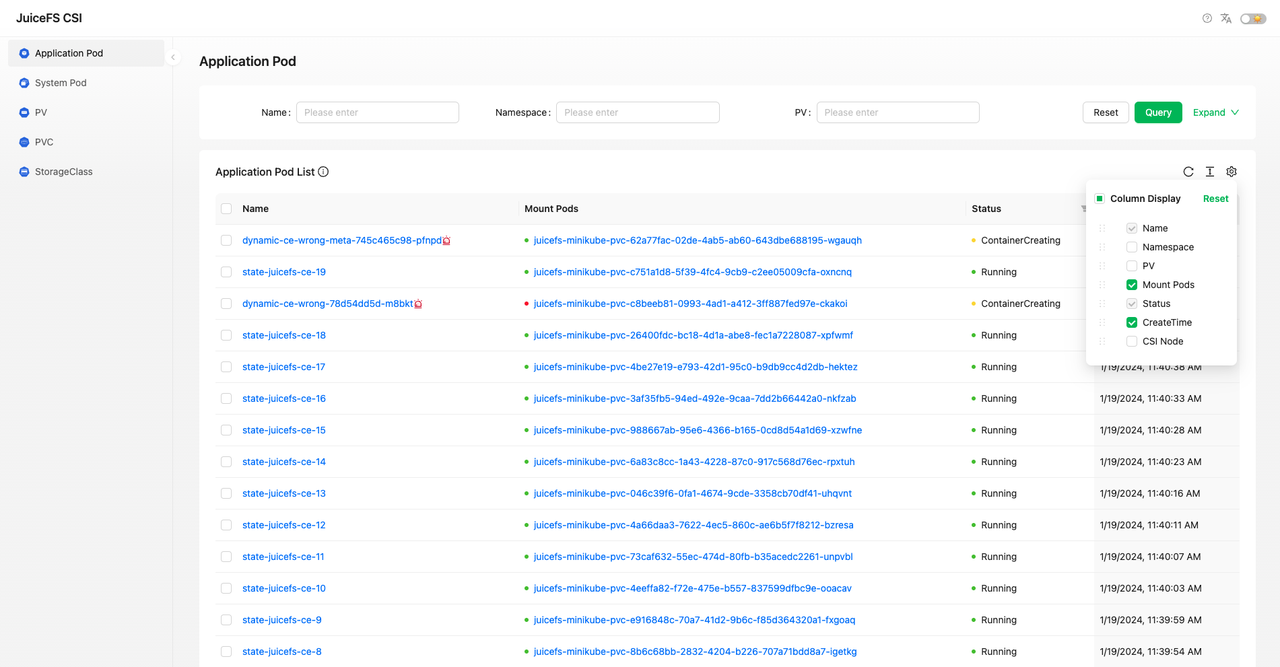
The list is initially sorted in descending order of creation time. You can filter, sort, and adjust the display content based on different fields.
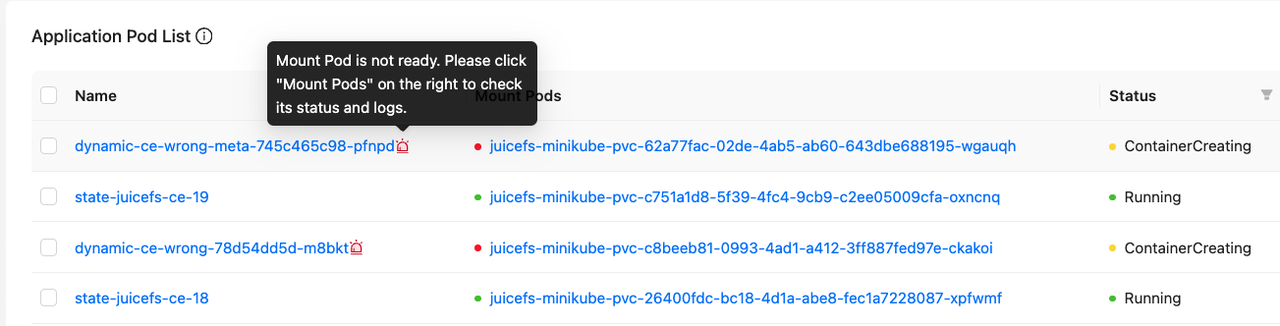
If a pod's running status is abnormal, there will be a red alert icon next to its name. Hovering over it provides a brief indication of the possible issue.
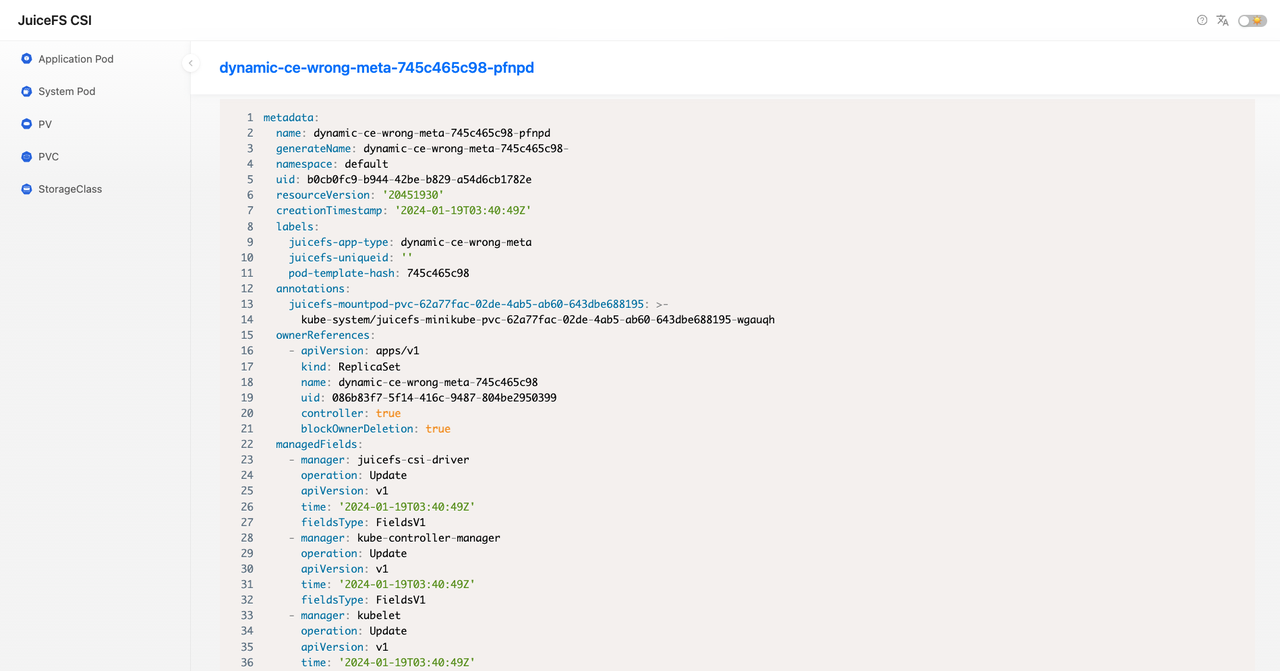
To view detailed information about a pod, click on its name to navigate to the pod details page:
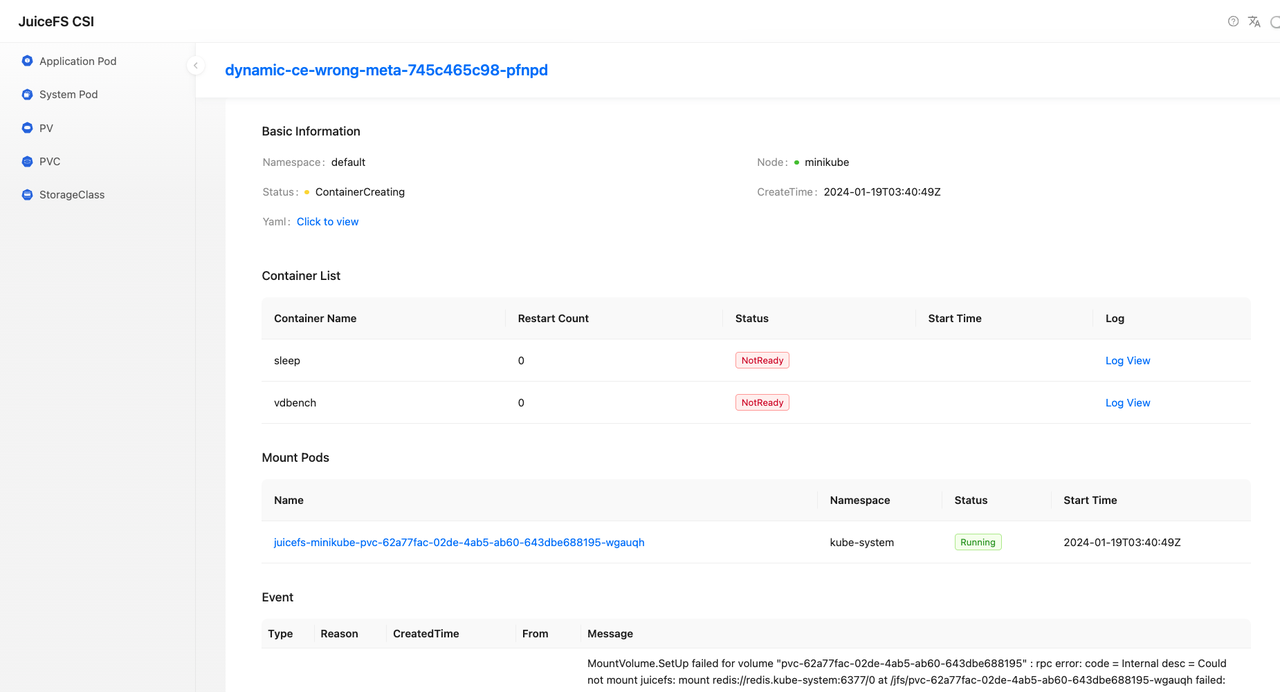
The pod details page includes basic information, a list of containers, mount pods providing services, and pod events. In the basic information section, you can click Click to view to preview the original definition and status of the pod.
You can click the back button in your browser or the pod name at the top to go back to the pod details page. Click on the mount pod name to jump to the mount pod details page.
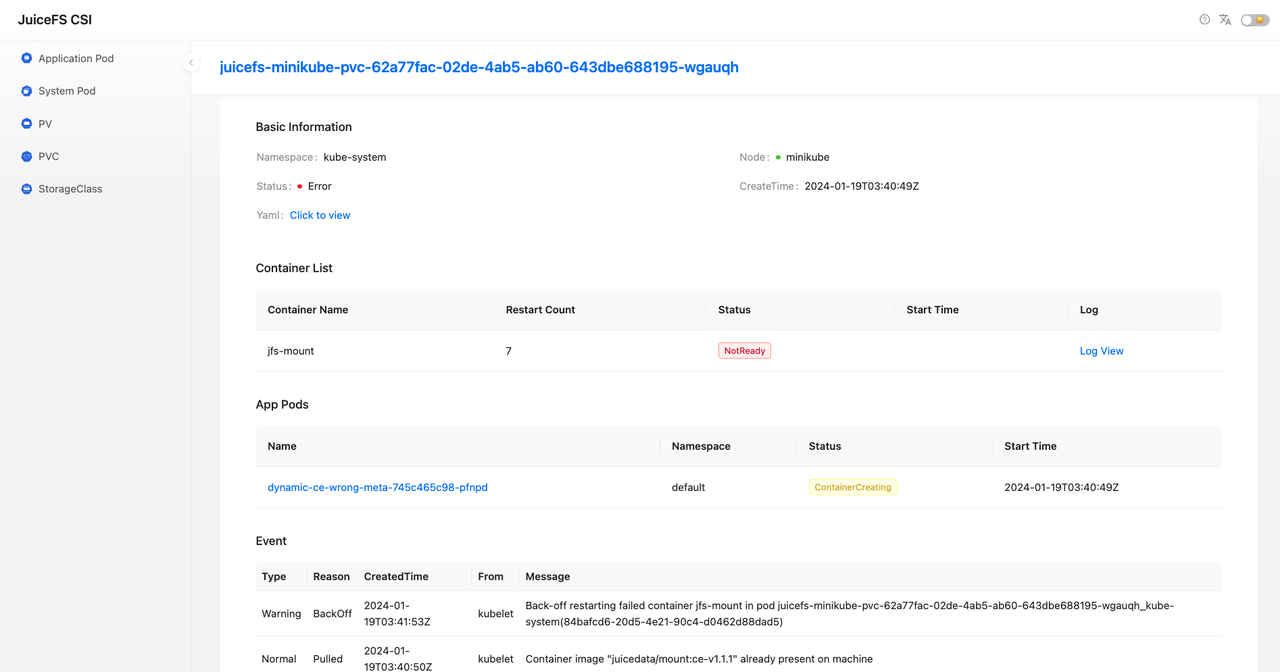
On the mount pod details page, you can see the latest event when the jfs-mount container failed. Click Log View for the jfs-mount container to check its error logs.
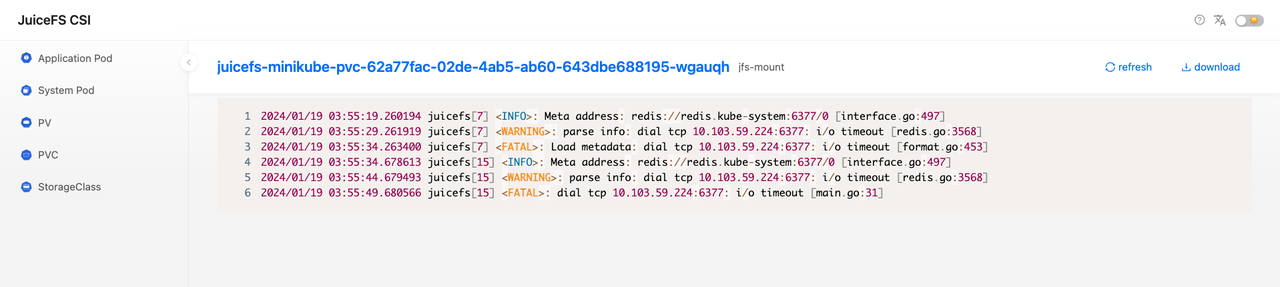
For example, we can see that the reason for the failure of the mount pod is the inability to connect to the Meta engine.
Another example is that we observed that a mount pod was rebuilt (it was in the Terminating status and then Running), which caused a failure in the application pod that used it.

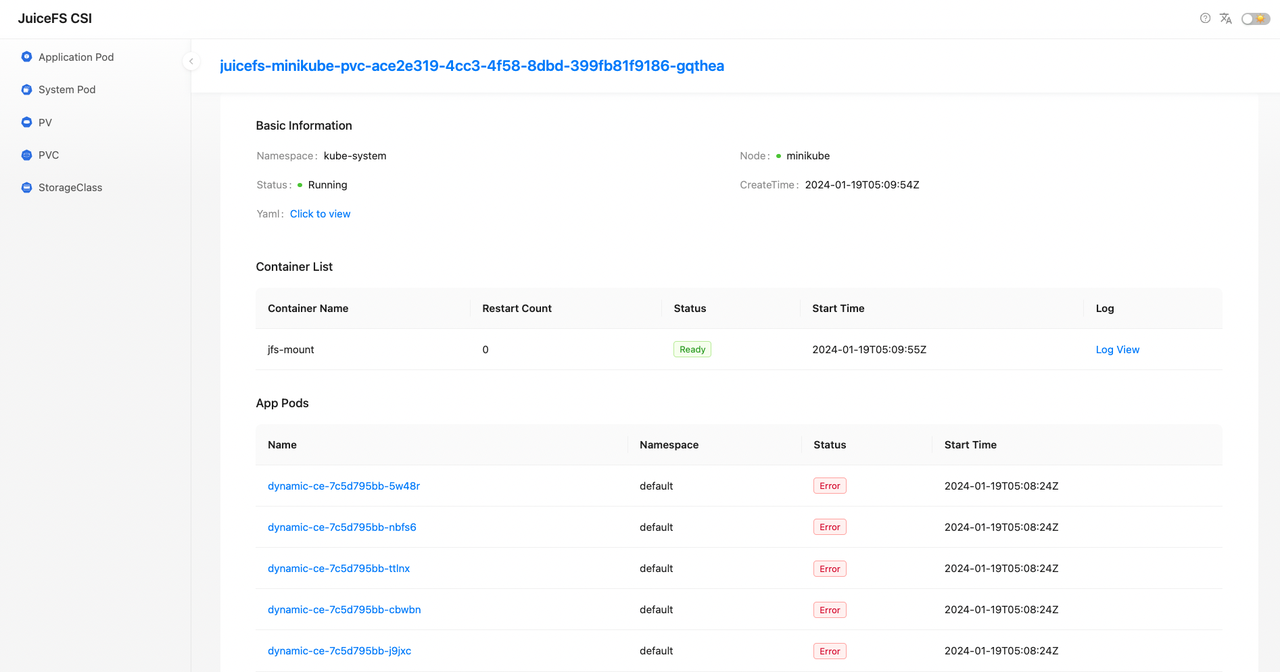
With the help of the dashboard, we quickly found all application pods using it, rebuilt the affected application pods, and restored application functionality.

In contrast, finding application pods based on mount pods using the conventional method mentioned earlier is quite cumbersome.
Future plans
PV scaling
JuiceFS CSI Driver 0.21.0 introduced support for dynamic PV scaling. However, the scaling operation requires using kubectl edit to edit the PVC, which is not user-friendly.
$ kubectl get sc dynamic-ce -o yaml | grep allowVolumeExpansion:
allowVolumeExpansion: true
$ kubectl edit pvc dynamic-ce-1
persistentvolumeclaim/dynamic-ce edited
We plan to incorporate dynamic PV scaling functionality into the dashboard for easier operations.
PV usage display
While you can use the df tool within application pods to check the capacity and usage information of JuiceFS volumes, the operation is not convenient, and the output requires additional screening.
$ kubectl exec dynamic-ce-7c5d795bb-g8dvj -c sleep -- df -h
Filesystem          Size  Used Avail Use% Mounted on
overlay              17G   14G  2.9G  83% /
tmpfs                64M     0   64M   0% /dev
tmpfs               7.9G     0  7.9G   0% /sys/fs/cgroup
JuiceFS:dynamic-ce  2.0G   72M  2.0G   4% /data
/dev/vda1            17G   14G  2.9G  83% /etc/hosts
shm                  64M     0   64M   0% /dev/shm
tmpfs                16G   12K   16G   1% /run/secrets/kubernetes.io/serviceaccount
tmpfs               7.9G     0  7.9G   0% /proc/asound
tmpfs               7.9G     0  7.9G   0% /proc/acpi
tmpfs               7.9G     0  7.9G   0% /proc/scsi
tmpfs               7.9G     0  7.9G   0% /sys/firmware
In the future, we plan to add capacity and usage display features to both the list page and PV details page of the dashboard.
If you have any questions or would like to learn more, feel free to join JuiceFS discussions on GitHuband our community on Slack.