


After deploying the JuiceFS file system and putting it into production, the next important task is to monitor its running status in real time. After all, it might be providing persistent storage support for mission-critical applications or container workloads. Any minor faults or performance declines could have adverse effects.
JuiceFS publishes its runtime status metrics in real time upon startup. It’s easy to establish a monitoring system by combining the open-source tools Grafana and Prometheus. This system will collect key file system metrics, such as read/write throughput, IOPS, latency, storage utilization, and request distribution, and aggregate them into an intuitive dashboard for comprehensive monitoring and visualization.
In this article, we’ll introduce how to use Grafana to monitor JuiceFS. In subsequent articles, we’ll dive into JuiceFS status metrics. Stay tuned.
About Grafana
Grafana is an open-source dashboard and visualization tool used for monitoring and analyzing time-series data. It’s primarily used for Internet infrastructure and application analytics, sensor data, application analytics, and monitoring. You can create and customize Grafana dashboards according to your needs to display the most critical data, track, and analyze key performance indicators (KPIs).
Grafana supports multiple data sources, including Prometheus, InfluxDB, and Elasticsearch. It aggregates data from various sources for analysis and visualization in a unified interface. With a user-friendly query editor, users can gain deeper insights into data and derive more information from it.
JuiceFS publishes file system status metrics by default via port 9567. You can collect these metrics using Prometheus and visualize them graphically using Grafana.

Prometheus and Grafana are both open-source software that can be downloaded and deployed independently. However, deploying and maintaining these systems can increase operational workload. For a simpler and more convenient way to build a visual status monitoring system for JuiceFS, you can try Grafana Cloud. It provides all the necessary components in one place and includes a certain amount of free usage, sufficient for initial usage needs.
About Grafana Cloud
Grafana Cloud is a SaaS service that offers free, pay-as-you-go, and advanced subscription plans. Different subscription plans include different resources. The main difference between free and paid plans is the retention period for metric data: - Free plans retain data for 14 days - Paid plans retain data for 13 months
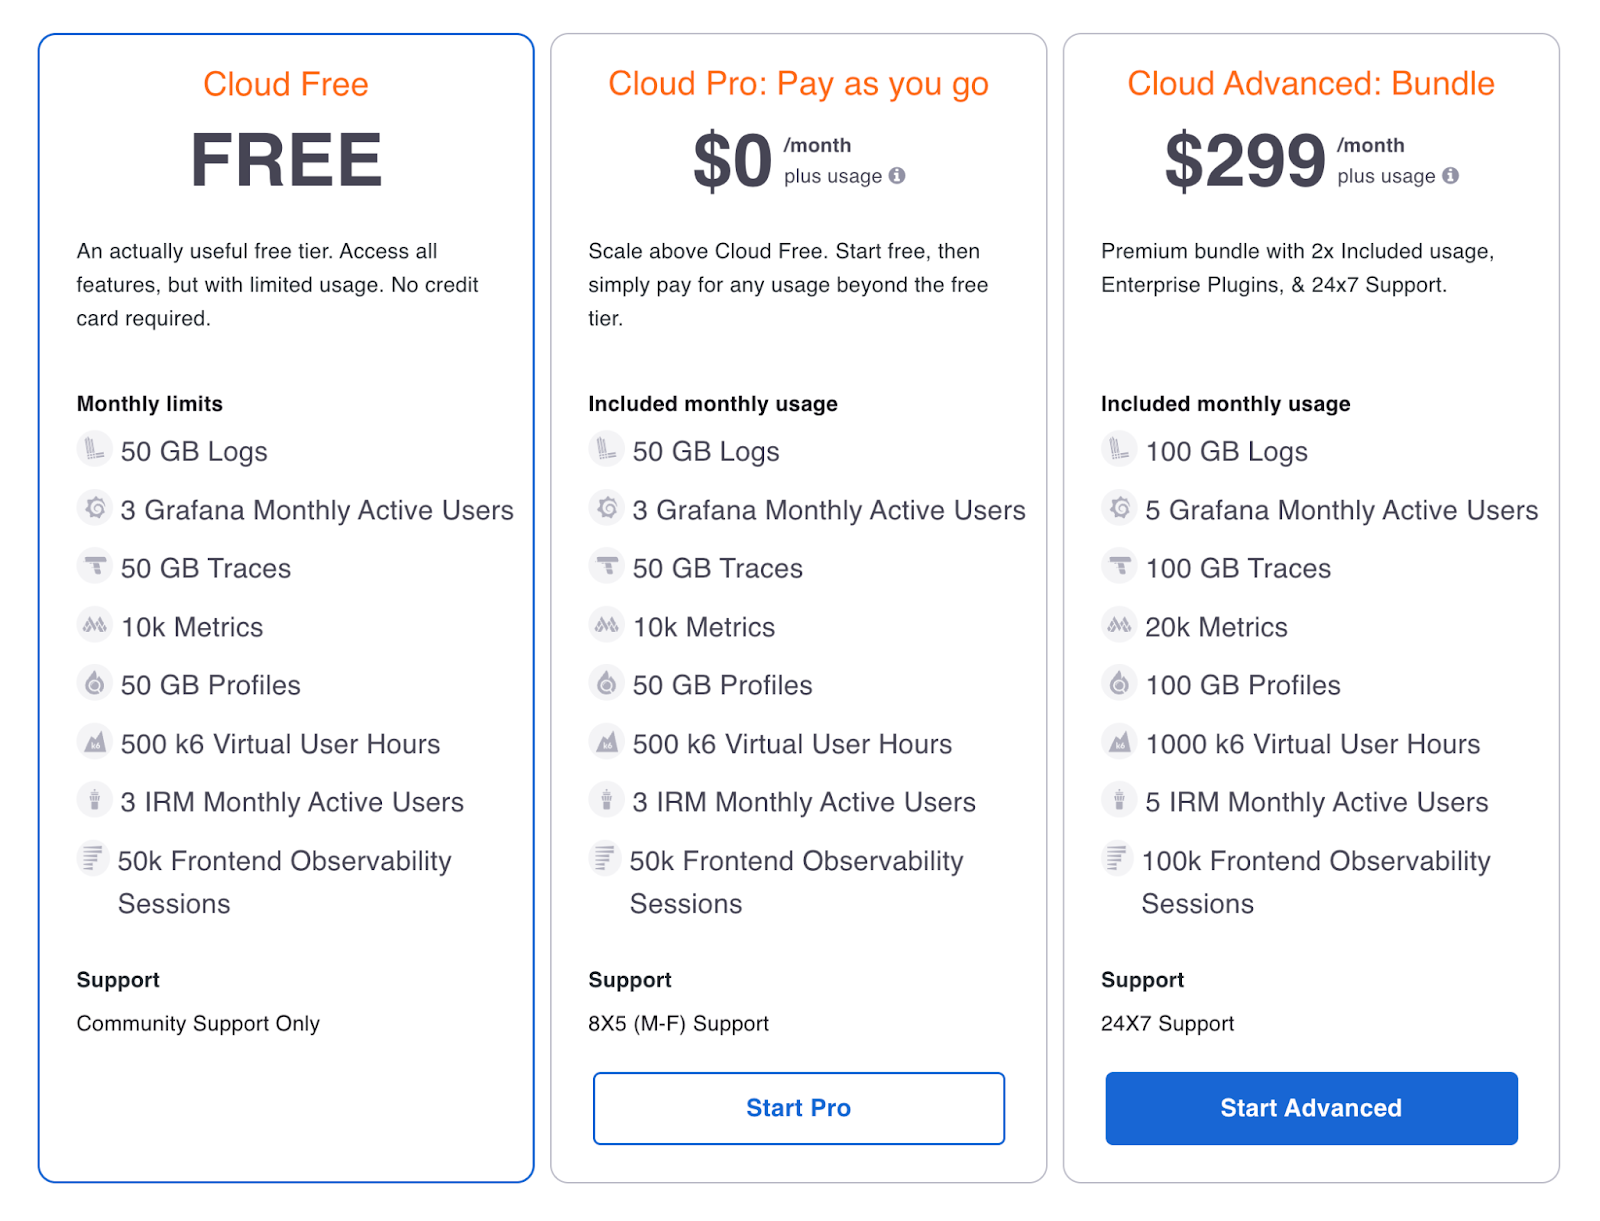
The advantage of Grafana Cloud is that it directly provides Prometheus and Grafana through SaaS services. Therefore, it solves data collection and visualization needs in one go, without requiring user intervention for maintenance and scaling later on.
Use Grafana Cloud to build a monitoring system for JuiceFS
To build a monitoring system for JuiceFS using Grafana Cloud, perform the following steps:
- Prepare and mount the JuiceFS file system.
- Register a Grafana Cloud account and create stack resources.
- Install and configure Grafana Agent locally to start reporting resources.
- Configure JuiceFS Dashboard and start using it.
Step 1: Prepare the JuiceFS file system
Both JuiceFS Community and Cloud Service Editions publish Prometheus-formatted status metrics in real time. Note that:
- By default, JuiceFS Community Edition publishes Prometheus-formatted status metrics via
http://127.0.0.1:9567on the host where the client is running. - JuiceFS Cloud Service publishes both Prometheus and JSON formats of metrics via the SaaS platform. You need to replace
VOLUME_NAMEwith the file system name andAPI_TOKENwith the corresponding token.
As shown in the figure below, the JuiceFS Cloud Service console displays the status metrics for the file system in the last 7 days. The hyperlinks the arrows point to are the two status publication addresses mentioned above. You can copy them for Prometheus use.
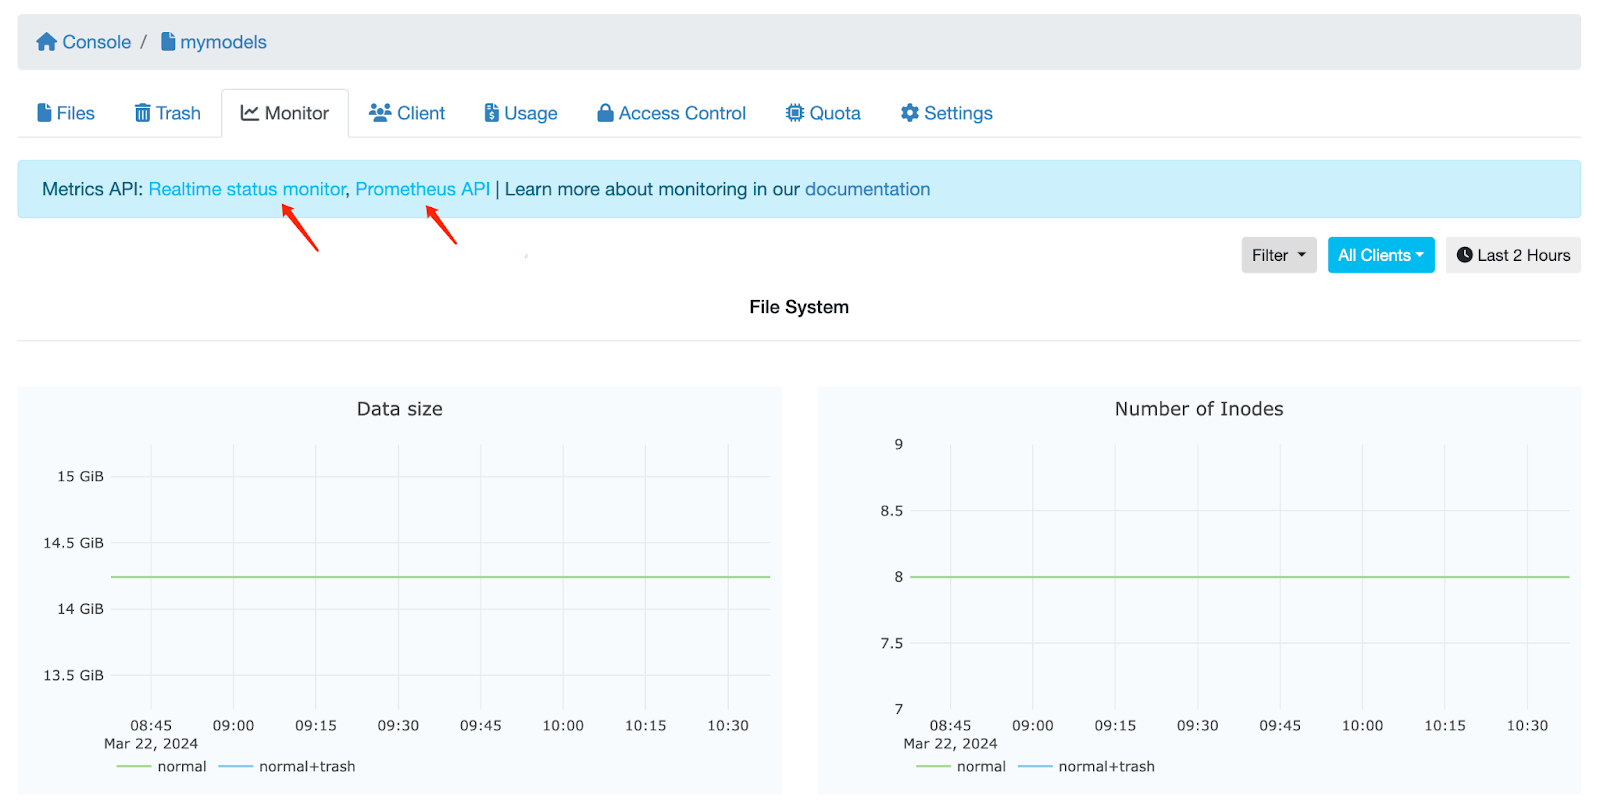
In addition, only mounted file systems have status metrics. Therefore, it's necessary to prepare the file system before starting.
For details on creating a JuiceFS file system, there are slight differences between the community edition and cloud service, but the principles are the same. For details, see the documentation.
Step 2: Register a Grafana Cloud account
The resources Grafana Cloud provides to users are called a stack (technology stack), because it provides many additional monitoring-related services such as Prometheus and Loki based on Grafana.
After registering an account, you’ll receive a dedicated xxx.grafana.net URL, such as https://juicefs.grafana.net, which directly accesses your Grafana console.
Step 3: Configure Prometheus Agent
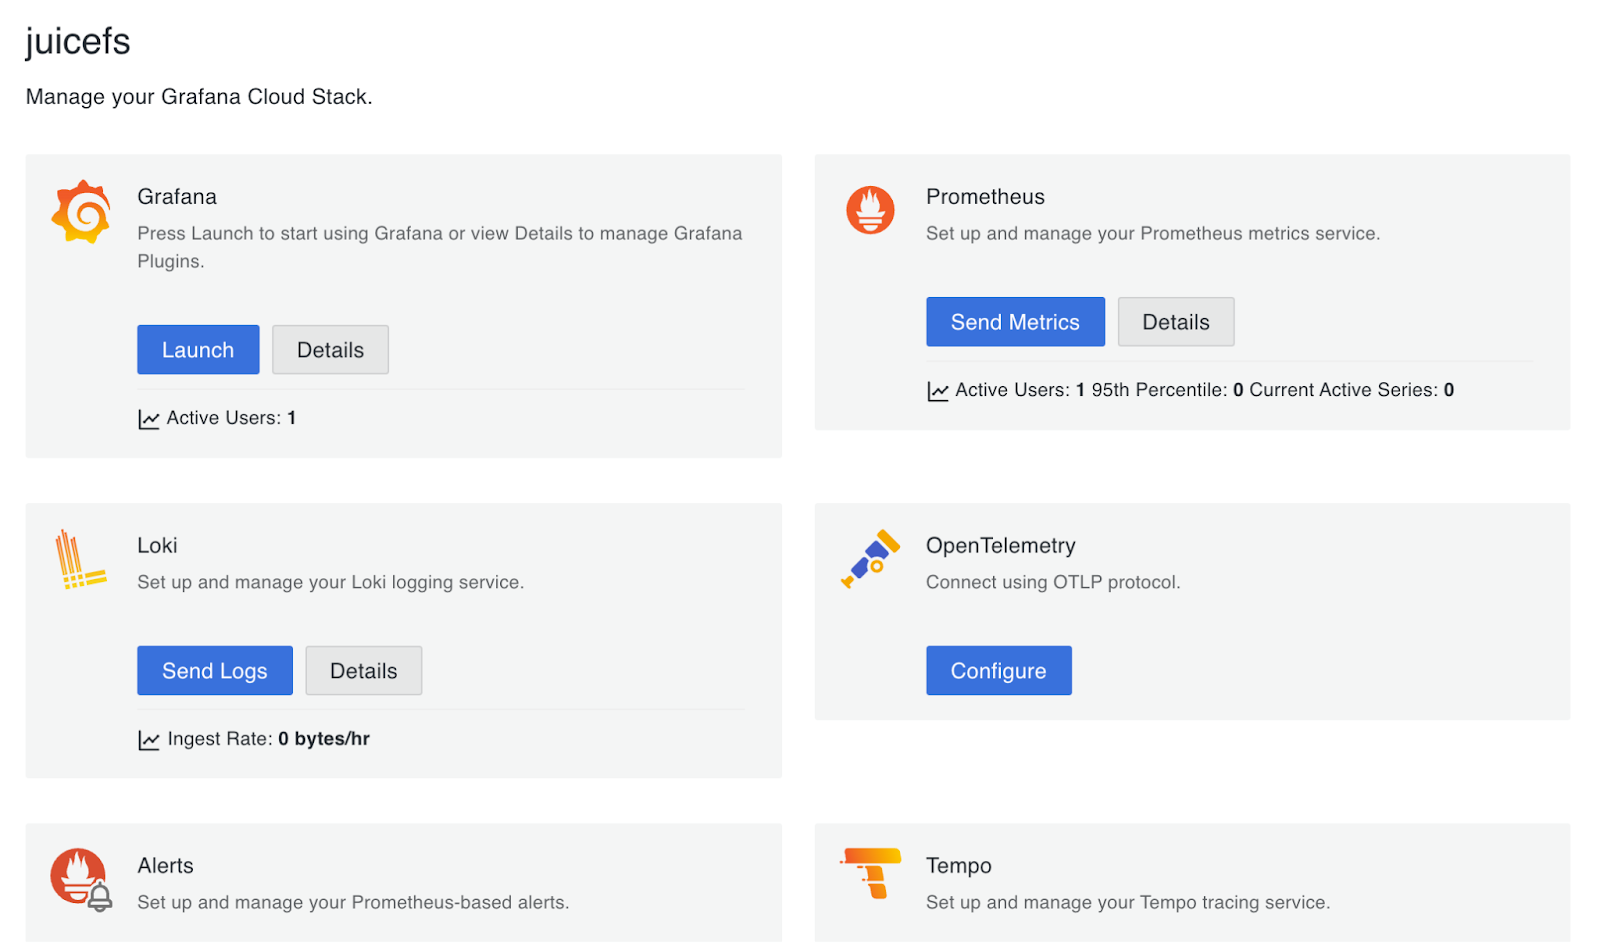
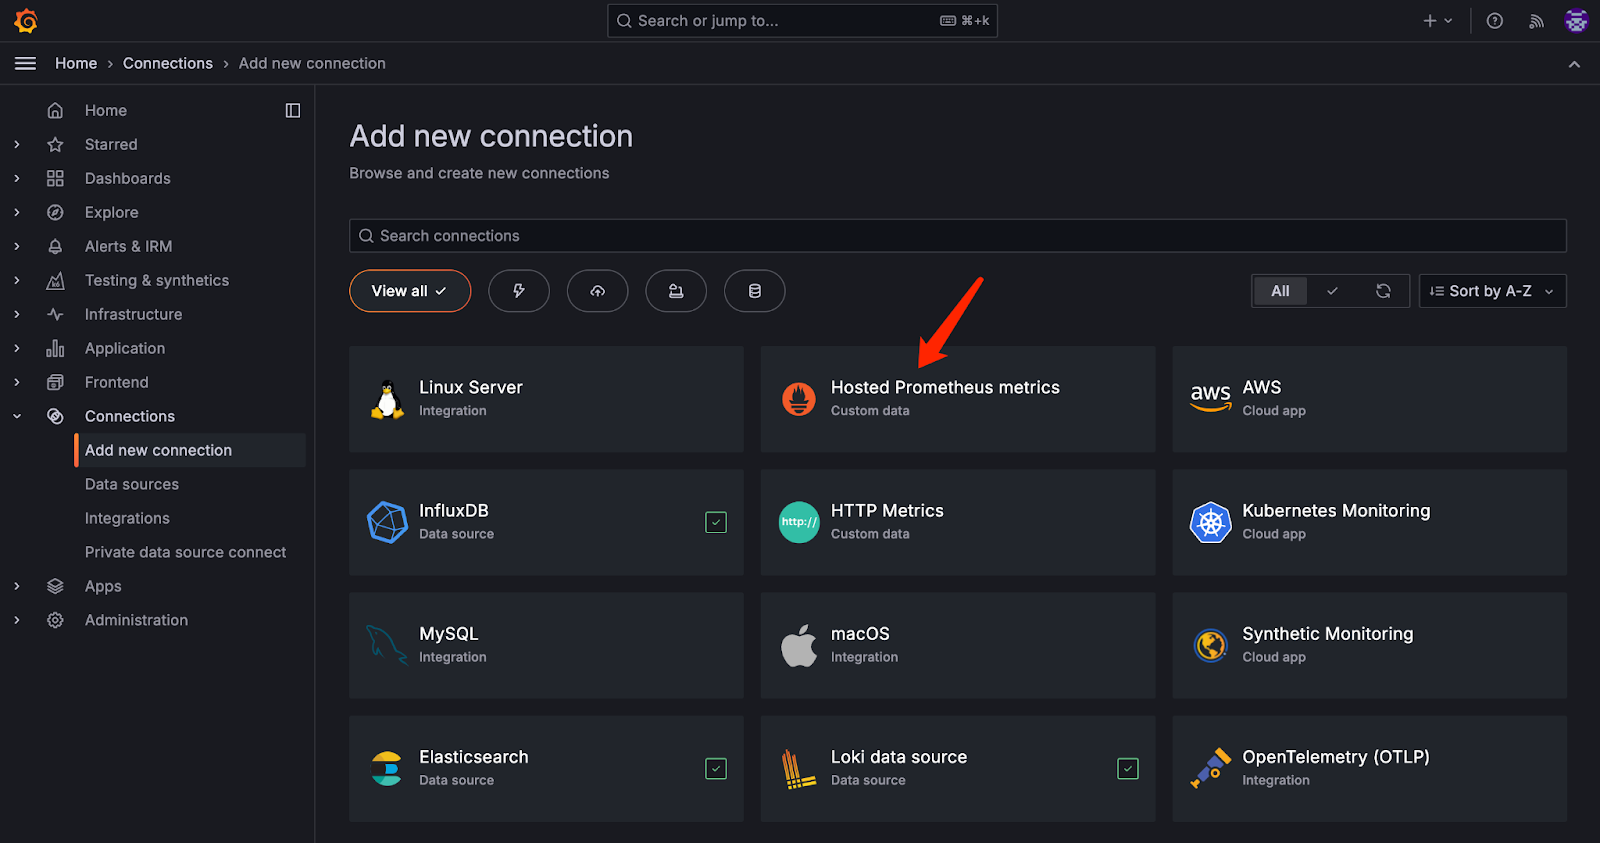
With a Grafana Cloud account and a stack, you can start configuring the data source. Grafana Cloud offers a range of connectable data sources.
JuiceFS publishes status information in Prometheus format by default, so select Hosted Prometheus metrics and configure based on your actual situation in the Configuration Details.
1. Choose a method to forward metrics
There are two optional methods:
- Installing the Grafana Agent client locally, which can upload JuiceFS status metrics to the Prometheus service on the cloud. This method keeps the metrics entirely in the cloud without a local copy, and it can be used together with Grafana Cloud's alerting service.
- Replicating data from locally maintained Prometheus to the cloud. This method requires self-deployment and maintenance of a Prometheus instance locally. Data will be fully stored locally and a copy will be sent to the cloud for use.
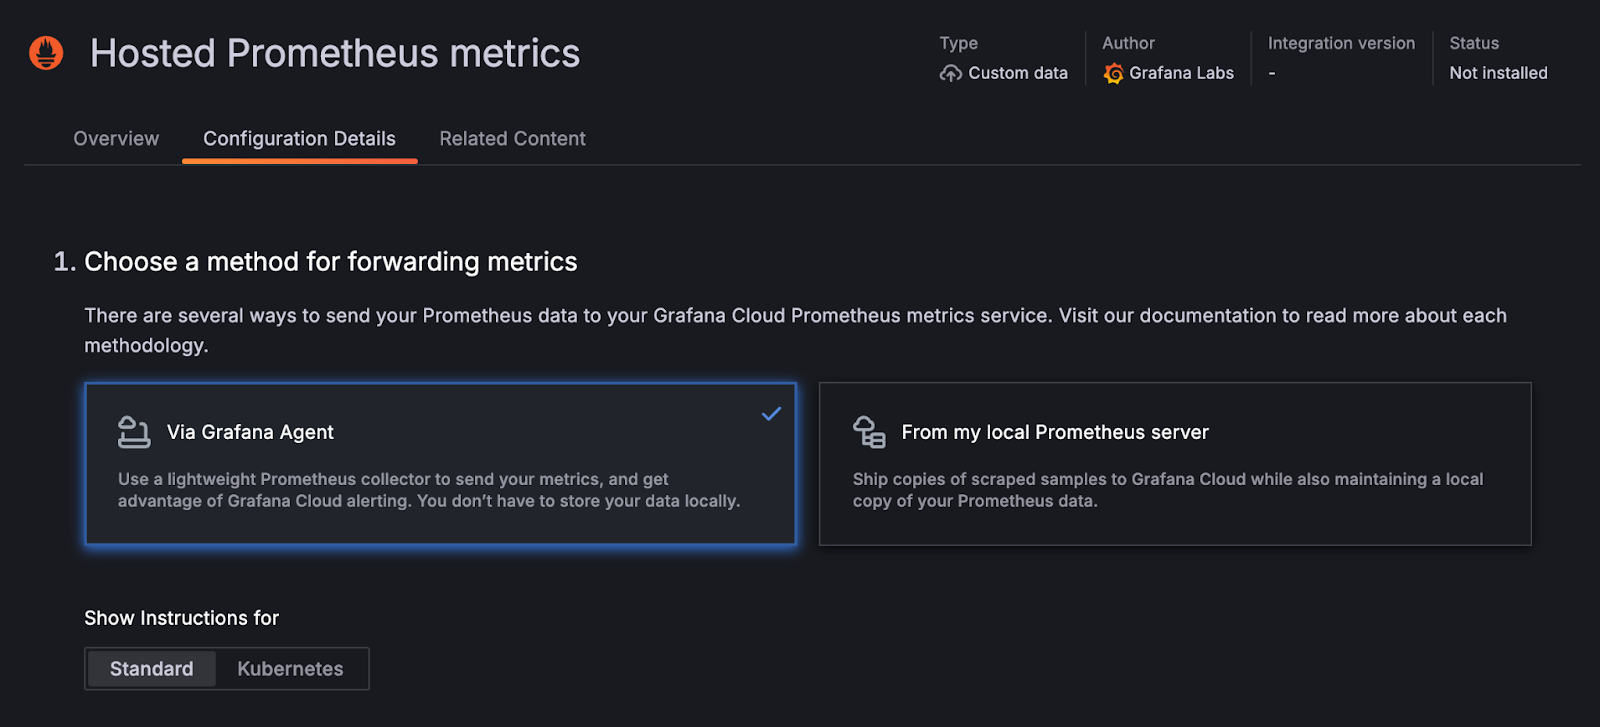
This article will use the first method as an example. For use in the Kubernetes environment, you can click Kubernetes for instructions.
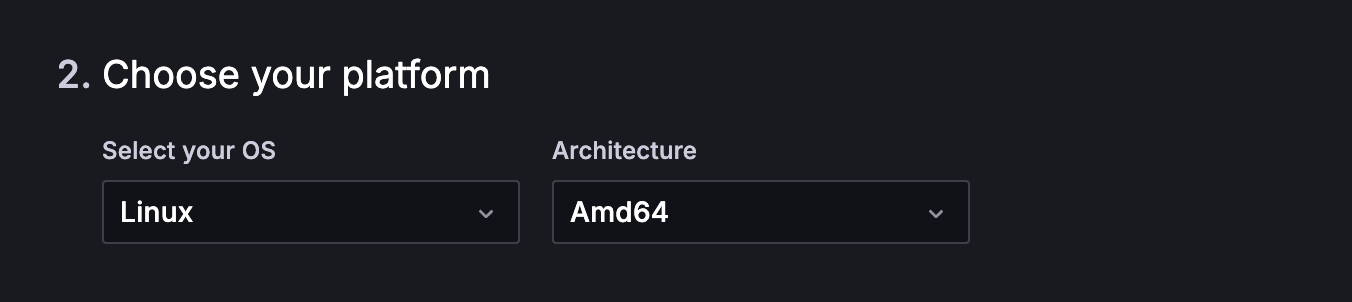
2. Select the system and architecture
To install the Grafana Agent on the local JuiceFS client's host, choose your platform based on the host’s system and architecture.
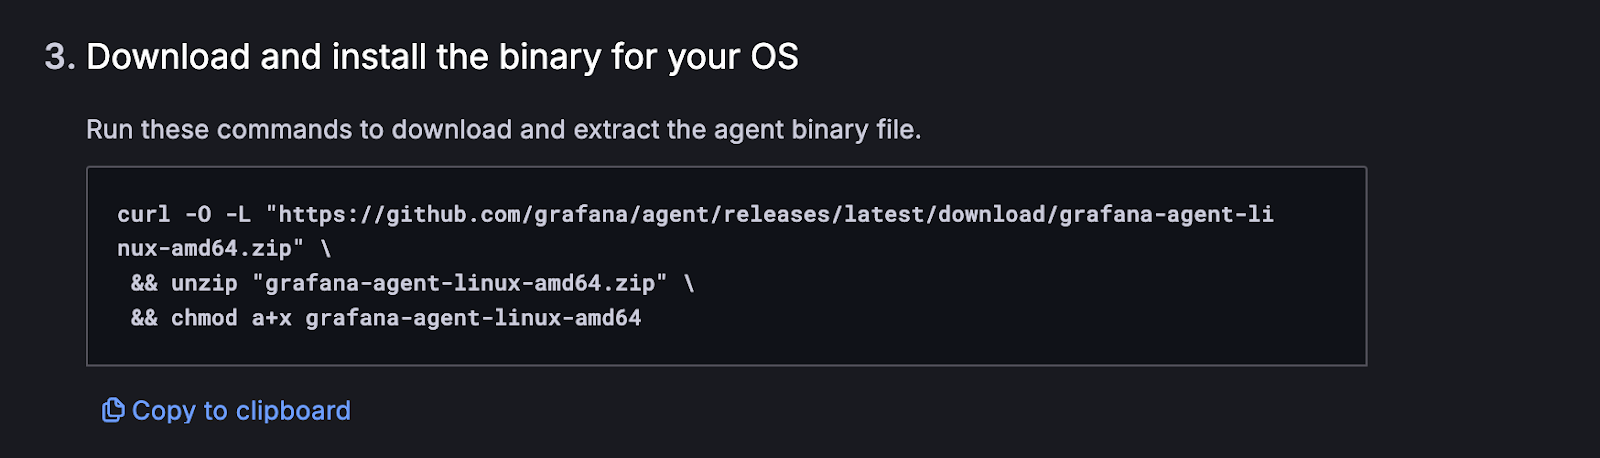
3. Download the Grafana Agent client
Copy and paste the provided code onto the JuiceFS host to download the grafana-agent client to the current directory and grant executable permissions. This grafana-agent program is essentially a customized Prometheus client.
4. Create a configuration file
This step generates a configuration file for grafana-agent. It’s essentially a Prometheus configuration file with Grafana Cloud's service address and related settings pre-configured.
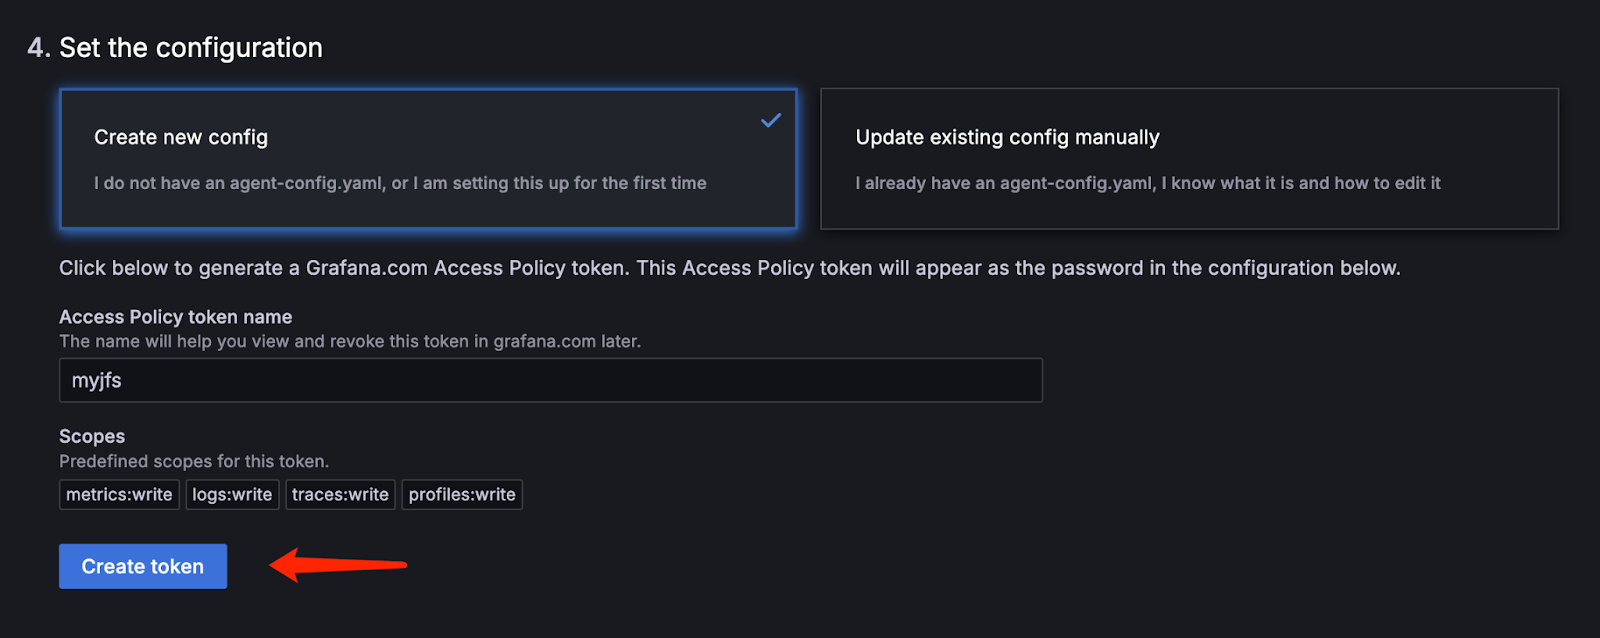
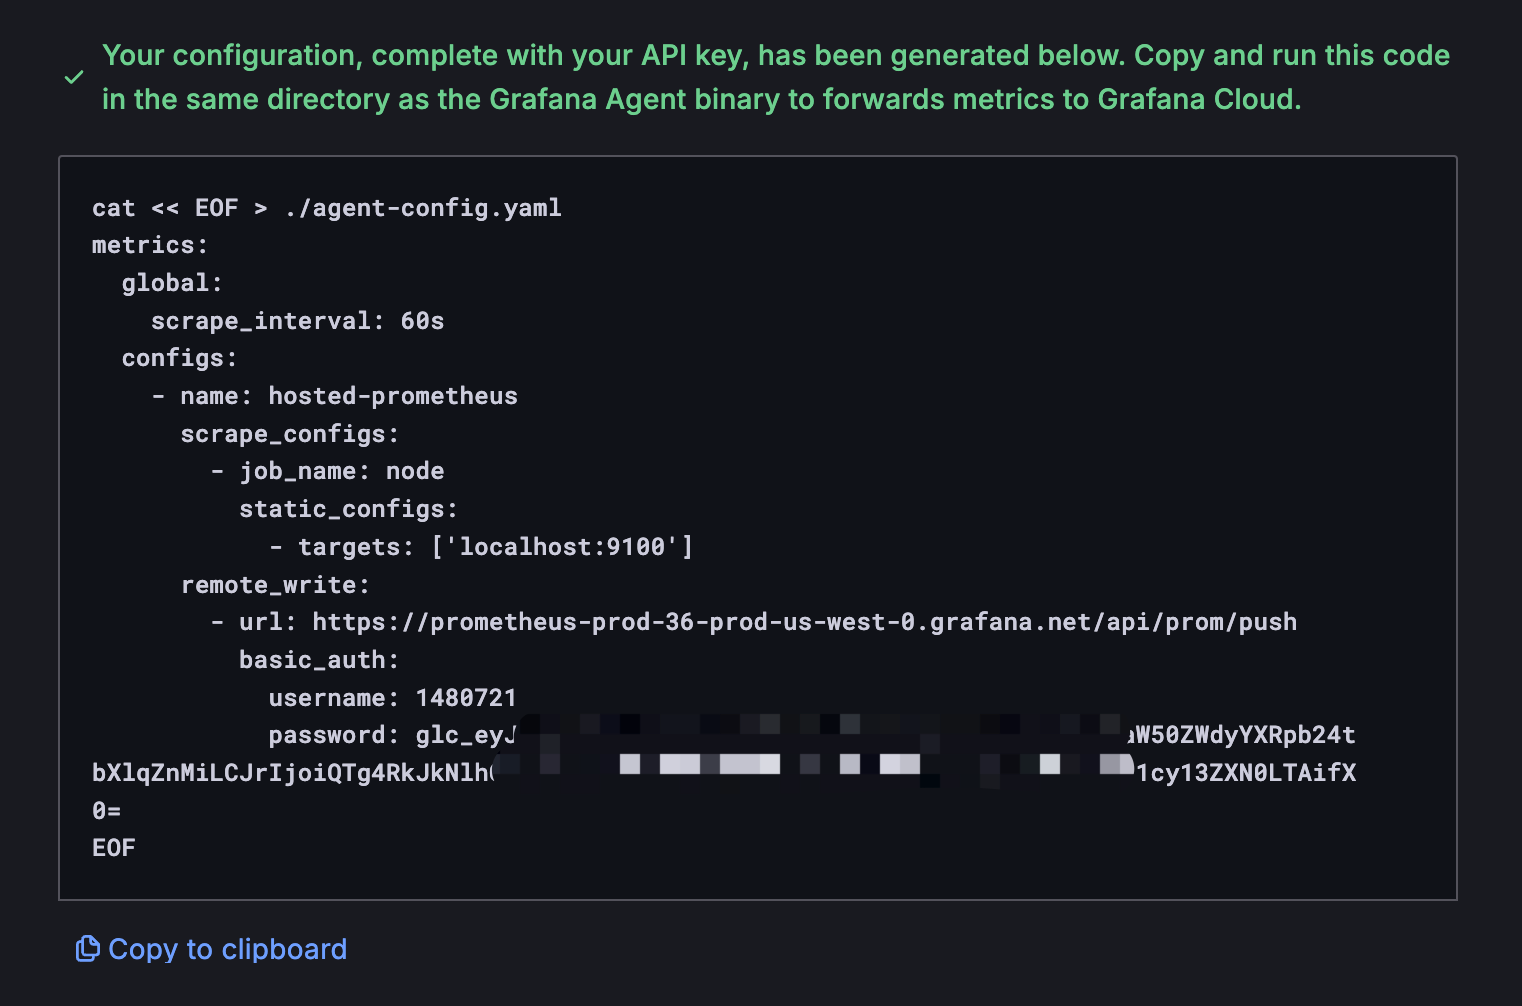
Paste the generated command to the JuiceFS host. It will write the relevant configuration information into the agent-config.yaml file in the current directory.
To enable it to collect JuiceFS file system status metrics, you need to modify this configuration file. Add the JuiceFS status metrics publishing address and adjust the scrape_interval of data for frequency.
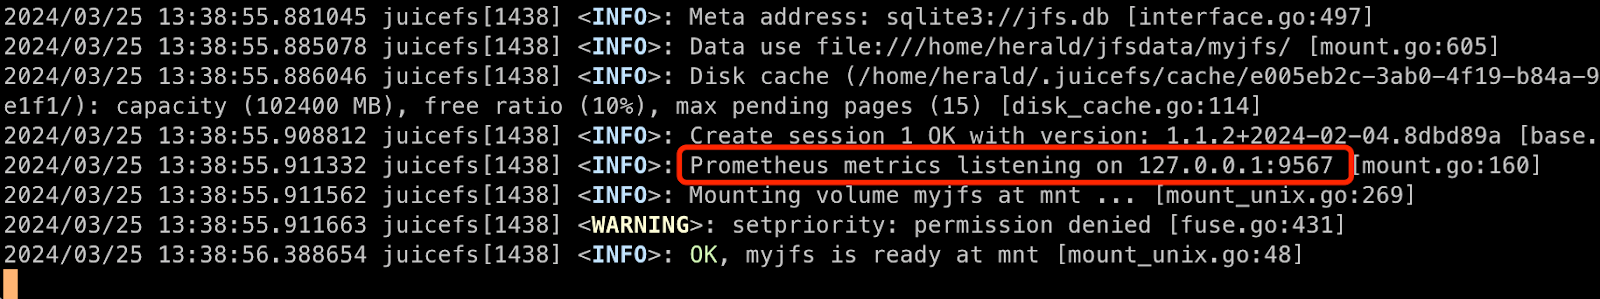
As mentioned earlier, JuiceFS Community Edition publishes status metrics through port 9567 by default as shown in the figure below.
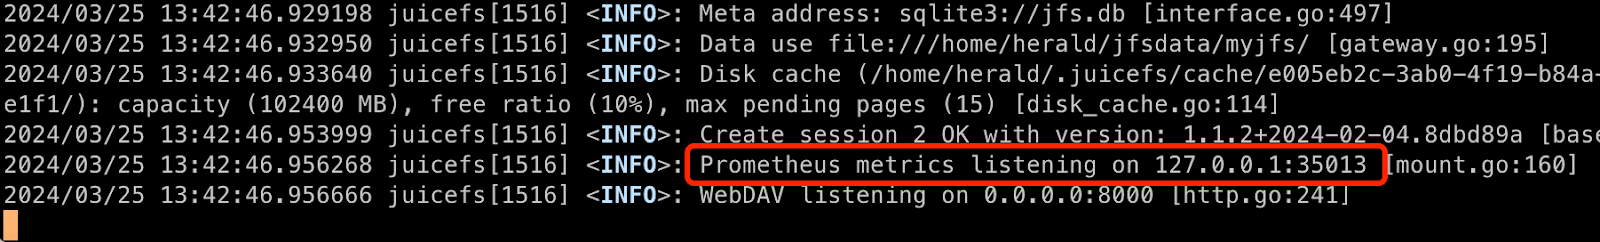
However, using different access methods on the same host will assign a random port to the second access method. Taking the following figure as an example, this host mounts the file system via both the mount method and WebDAV simultaneously, JuiceFS will allocate a random port to WebDAV for status metric publishing.
Edit agent-config.yaml based on the actual information. Here is an example of the modified configuration:
metrics:
  global:
    scrape_interval: 15s
  configs:
    - name: hosted-prometheus
      scrape_configs:
        - job_name: node
          static_configs:
            - targets: ['localhost:9100']
  - job_name: juicefs
    static_configs:
      - targets: ["localhost:9567", "localhost:35013"]

      remote_write:
        - url: https://prometheus-prod-36-prod-us-west-0.grafana.net/api/prom/push
          basic_auth:
            username: 1480721
            password: glc_eyJvIjo
Note that:
- In the 3rd line, set scrape_interval to 15s or less to capture real-time status changes of JuiceFS.
- In the 10th line, add JuiceFS-related configuration. In the array of the targets section, you can add the addresses of all release status metrics according to the actual situation.
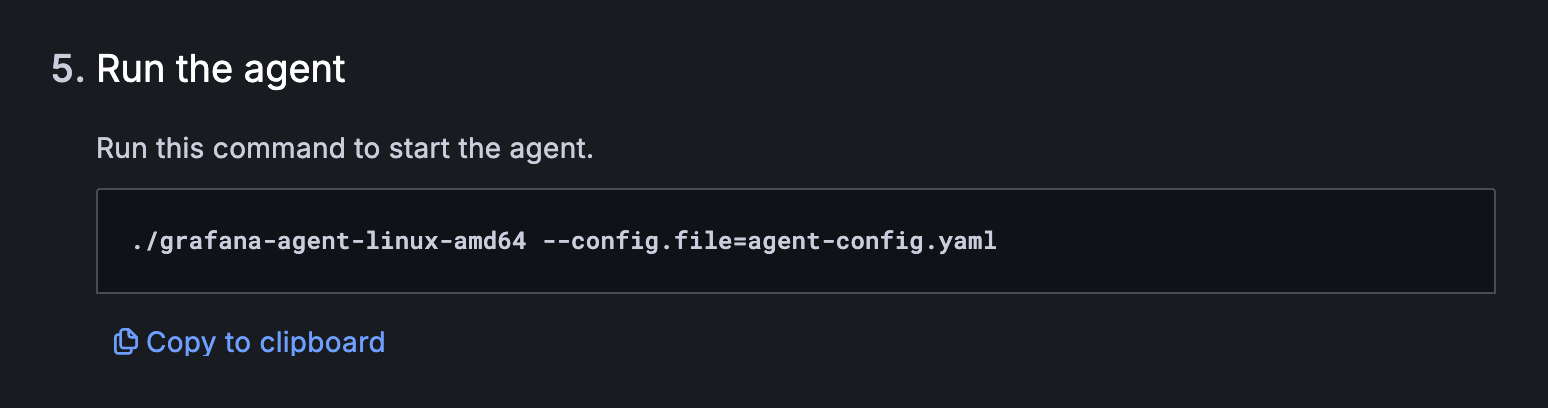
5. Start the agent
Paste and run the command on the JuiceFS host to start the grafana-agent program.
If needed, you can configure the grafana-agent client as a systemd service for automatic startup. Below is an example configuration file named grafana-agent.service:
[Unit]
Description=Grafana Agent
After=network-online.target

[Service]
ExecStart=/opt/grafana-agent/grafana-agent-linux-amd64 --config.file=/opt/grafana-agent/agent-config.yaml
Restart=always
User=root
Group=root

[Install]
WantedBy=multi-user.target
When you use this auto-start configuration, ensure to copy the grafana-agent-linux-amd64 program and the agent-config.yaml configuration file to the /opt/grafana-agent directory.
Step 4: Configure Grafana Dashboard
The preceding three steps connect the local JuiceFS and the Prometheus service provided by Grafana Cloud. The grafana-agent program fetches JuiceFS status metrics every 15 seconds according to the configuration and pushes the data to the cloud in real time.
With real-time collected status data, the next step is to visualize them graphically. It requires creating a dashboard in Grafana.
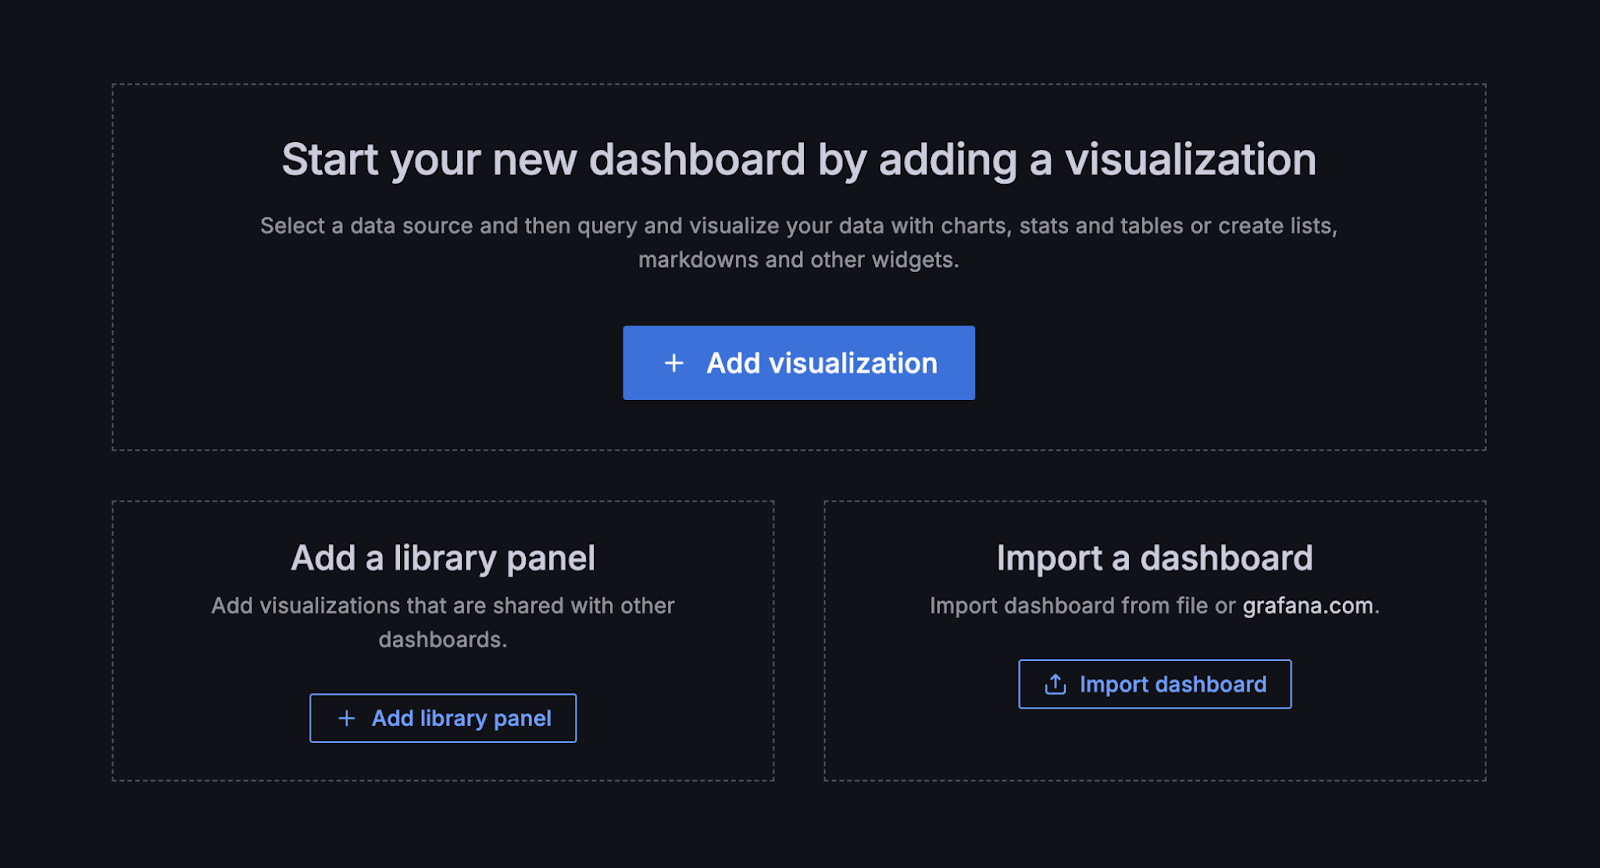
There are two common methods:
- Creating a new dashboard, defining queries, charts, states, and tables based on your monitoring needs.
- Importing a pre-created dashboard template, which can be a JSON file template or a public template from the Grafana official library.
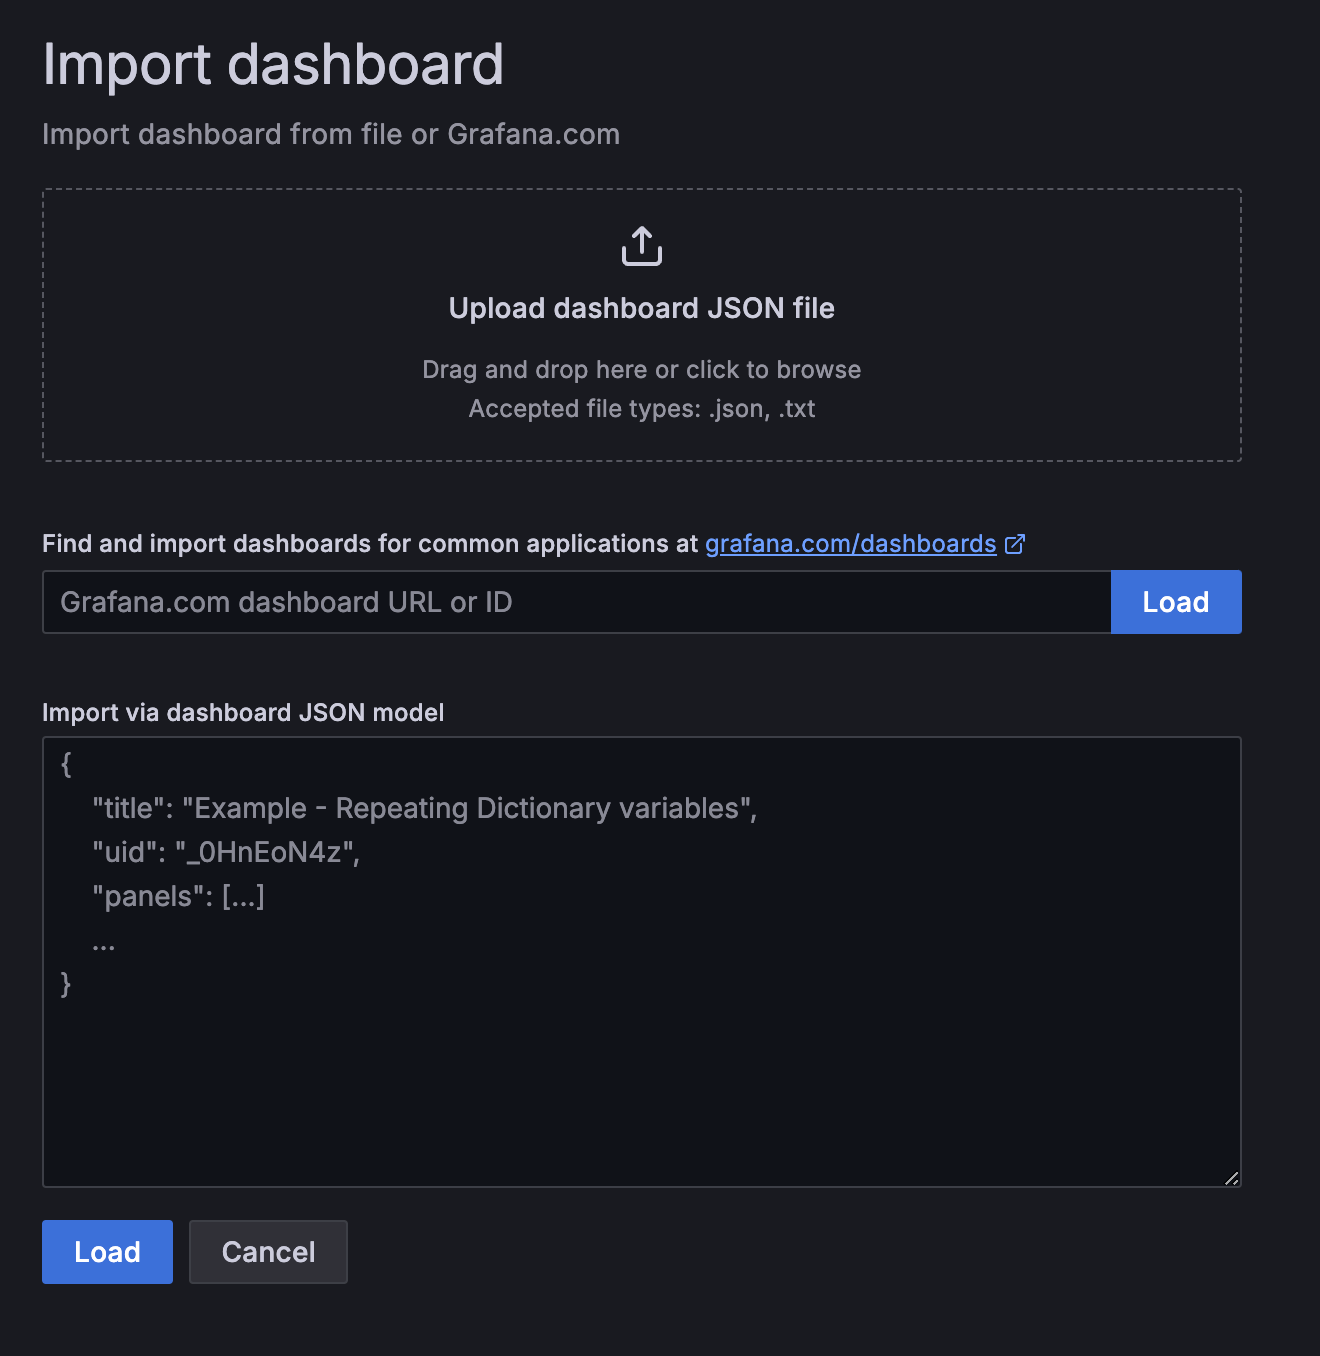
1. Use a dashboard template
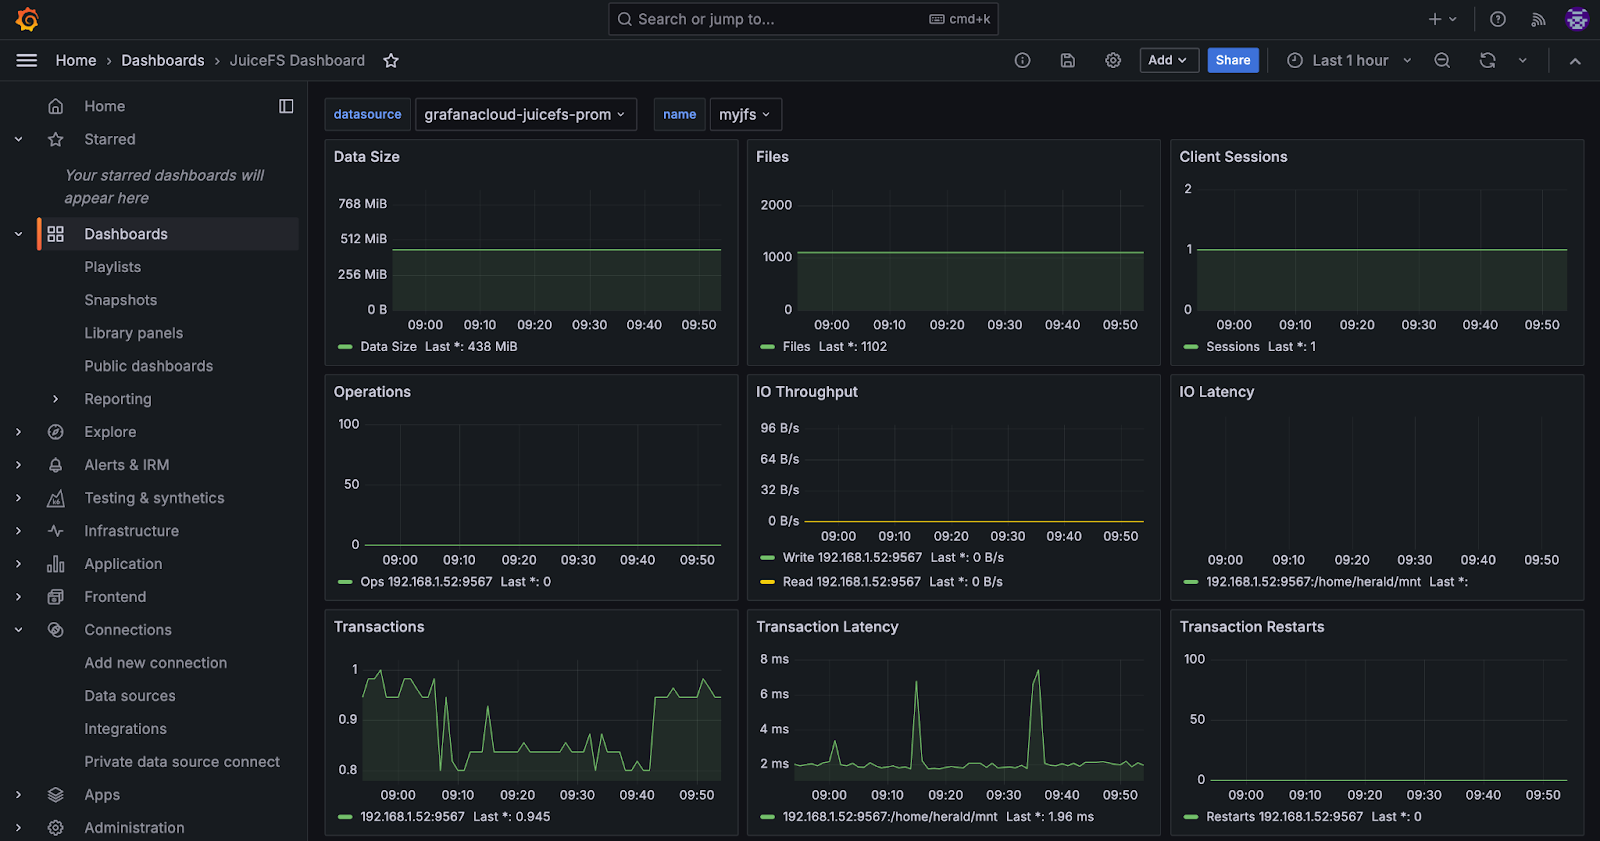
JuiceFS provides a pre-defined Grafana Dashboard template named grafana_template.json for displaying mount points, S3 Gateway, Kubernetes, and Hadoop Java SDK metrics. This template is available in the Grafana official Dashboard repository. You can either use the URL or the template number 20794 to load it.
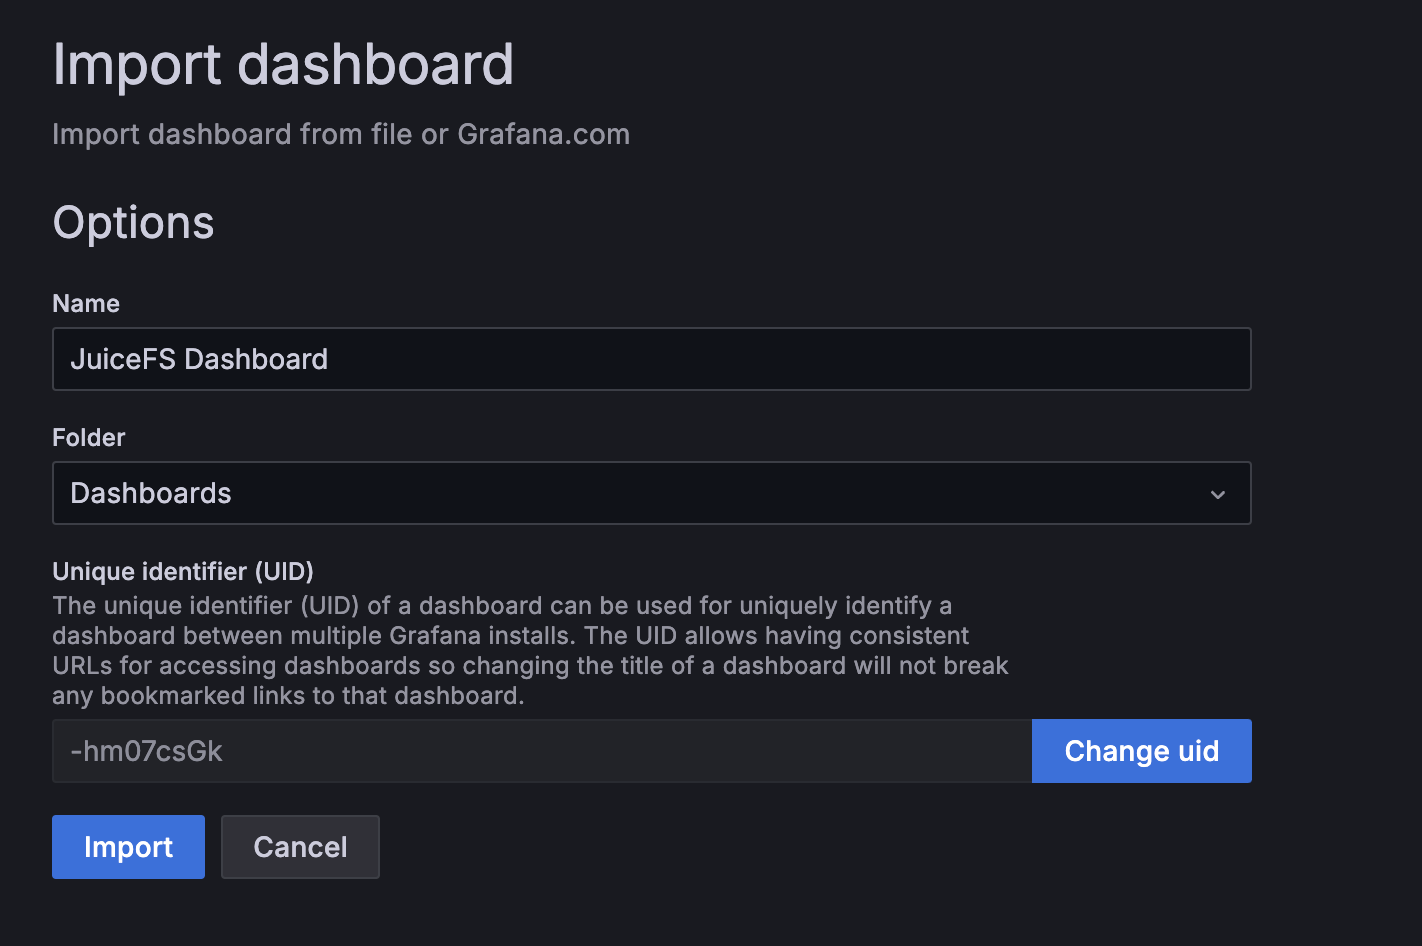
When importing the template, you can customize the dashboard name and storage location, typically keeping the defaults.
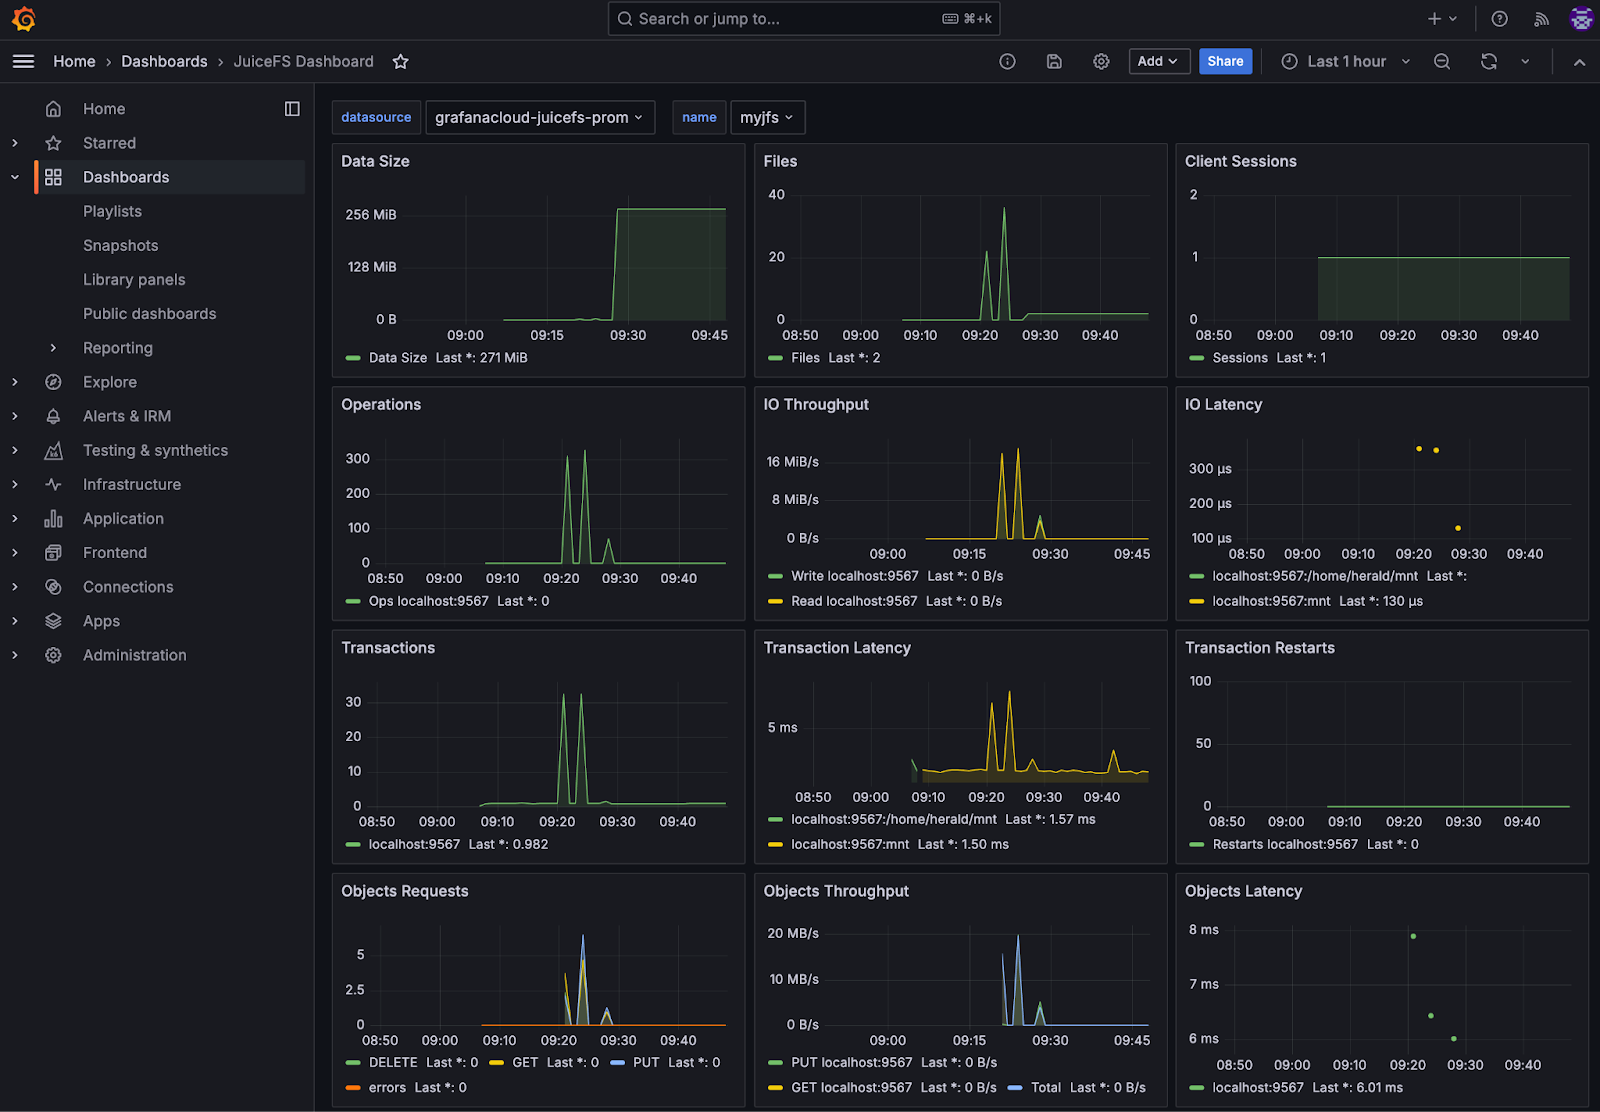
As shown in the figure below, the official template includes many status details presented in panels. You can adjust panel positions and styles or add/delete panels as needed.
2. Manually create a dashboard
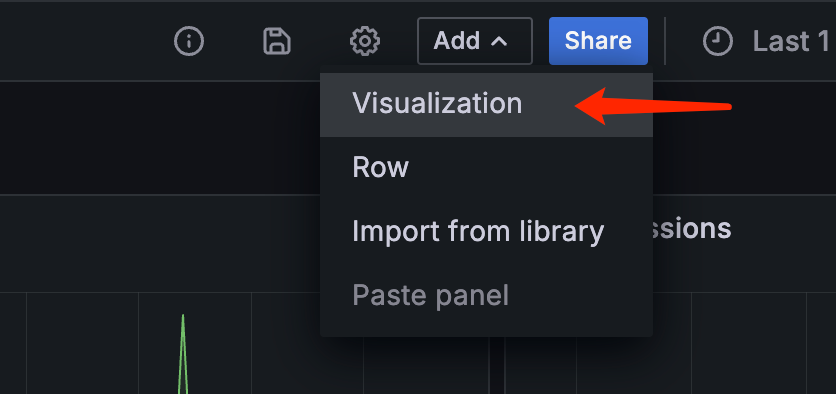
You can create a new dashboard from scratch or modify the JuiceFS Dashboard template. A dashboard consists of panels (visualization in Grafana). Adding a visualization means adding a panel.
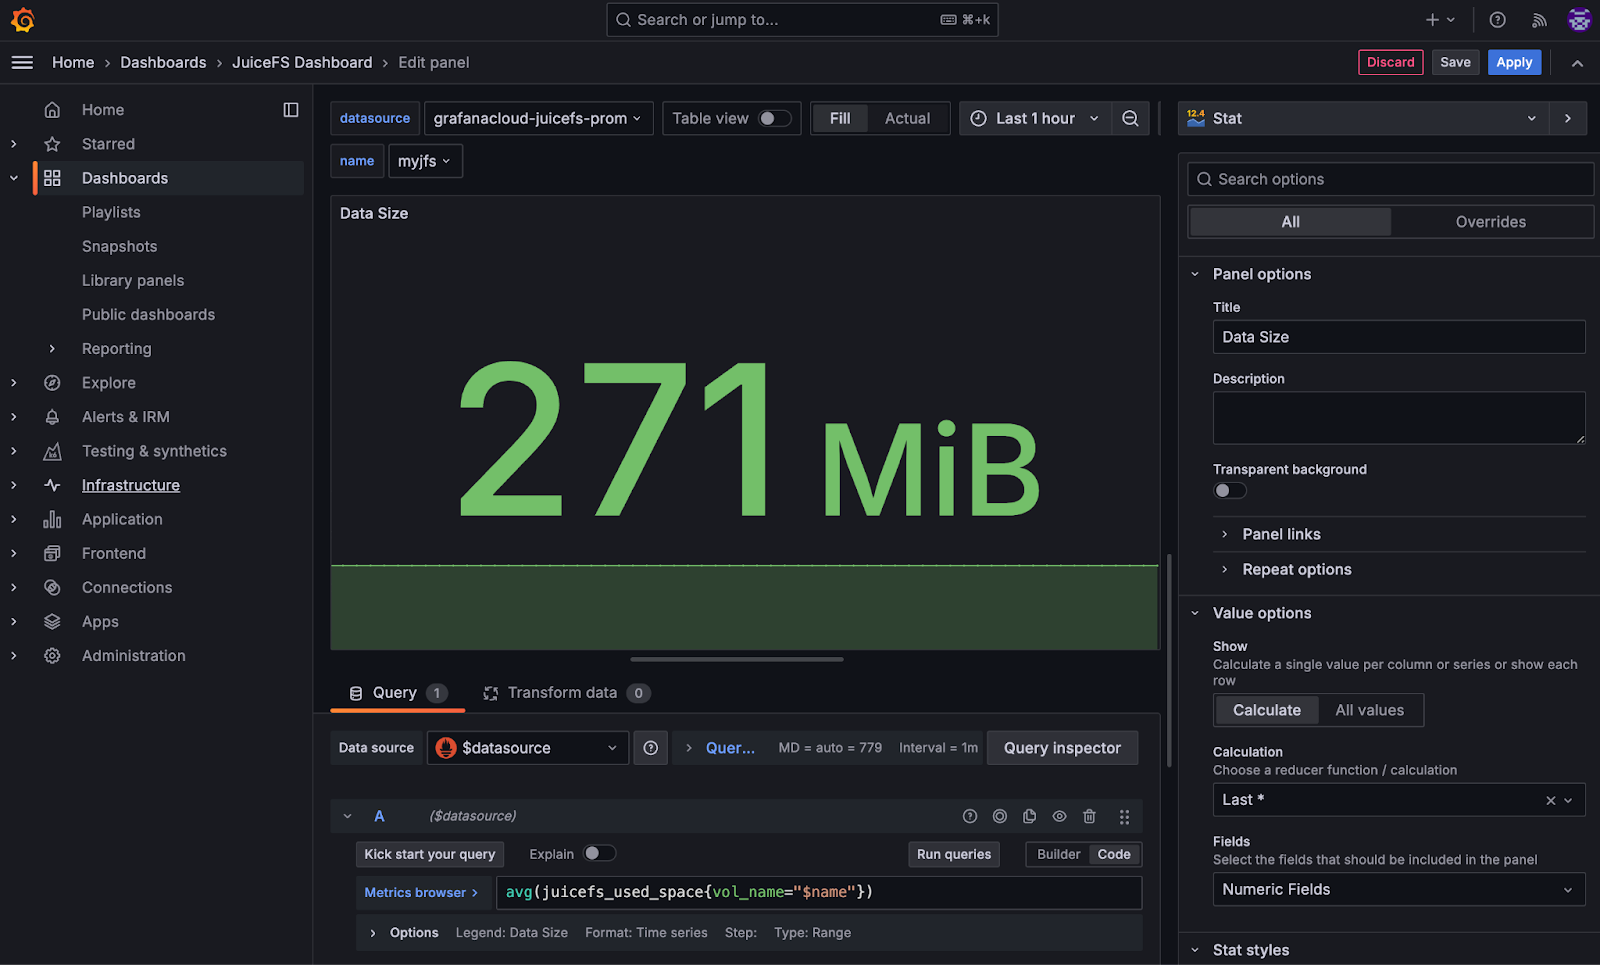
A panel visualizes a status metric. In the top-right dropdown menu, choose the data presentation format such as chart, table, or stat.
In the Query area below, select Data source, which is the Prometheus service collecting JuiceFS status metrics. Then, choose the desired metrics to query in the Metrics browser. The sidebar provides options to fine-tune displayed content like colors and conditional formatting.
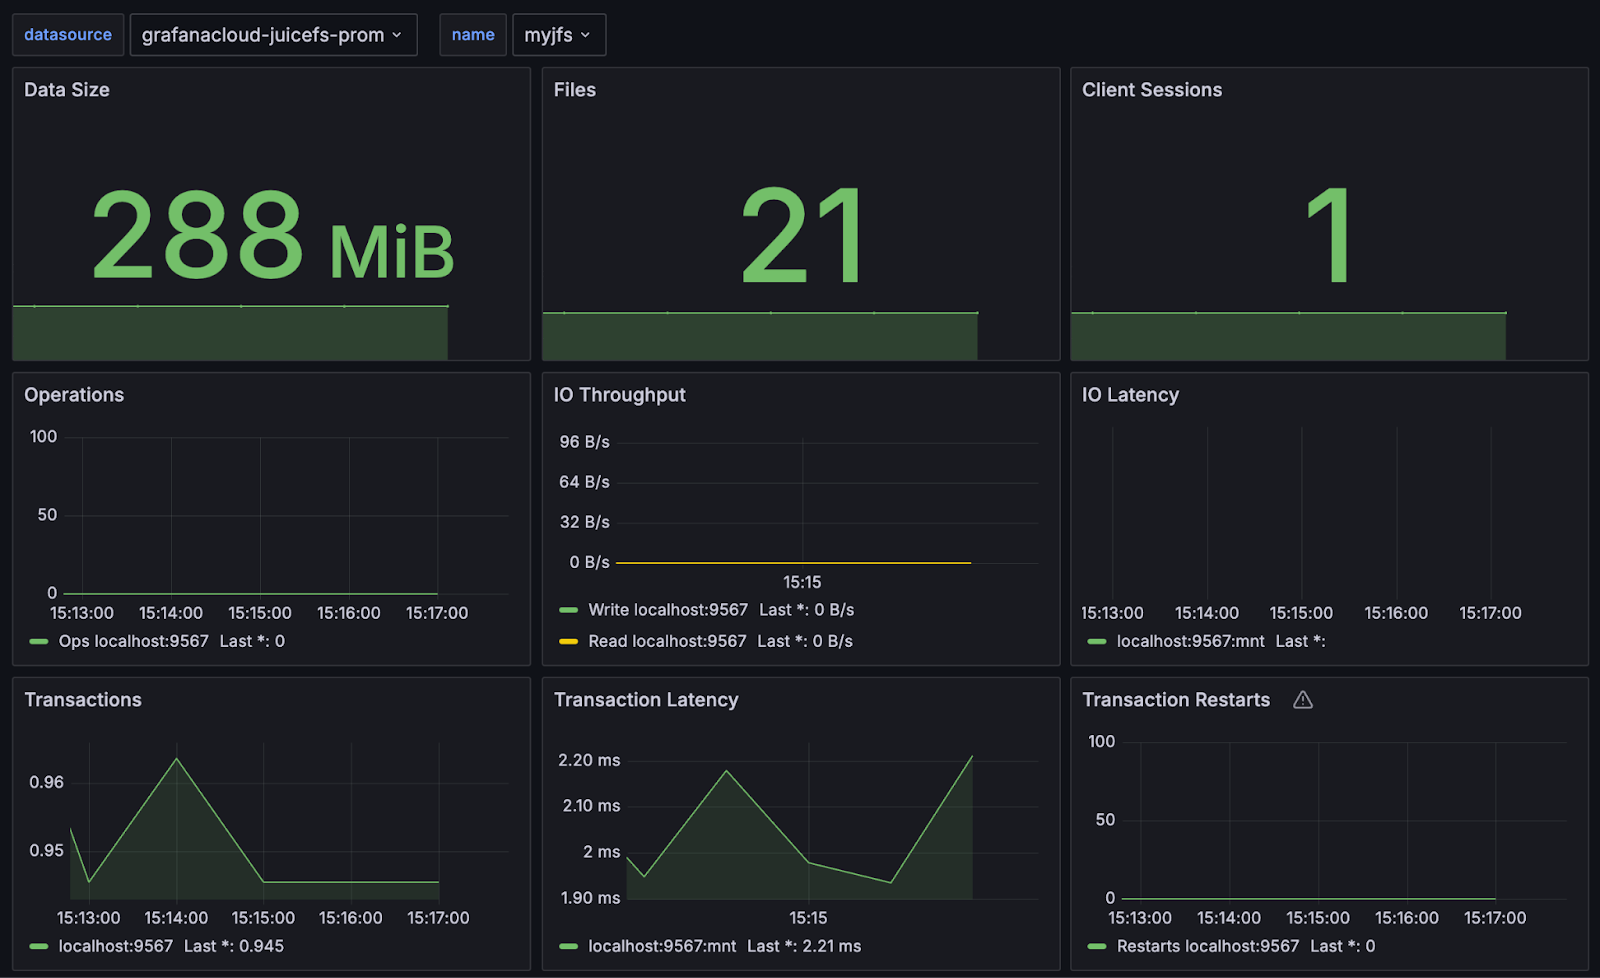
As shown in the figure below, you can switch between panels in the dashboard. For example, you can change some chart panels from the JuiceFS official template to stat type, and you can also create multiple different visualizations for the same metric.
Now, the visualization monitoring system for JuiceFS is complete. You can refer to JuiceFS Metrics to understand the meaning of various status metrics. In the near future, we’ll write another article to interpret JuiceFS status metrics in detail. Stay tuned!
Conclusion
This article described how to use Grafana Cloud to build a visual status monitoring system for JuiceFS. To cater to readers with different levels of experience, we used the simplest methods for each step.
In reality, building any IT system is a stack of choices. It's noticeable that in the steps of this article, there are various options available. For example, for Prometheus data reporting, we chose Grafana Agent, but you can also use locally deployed Prometheus. Therefore, this article is just a starting point for you. You can flexibly choose and combine the deployment and usage methods.
We hope this article will be helpful in building a JuiceFS monitoring system. If you have any questions, feel free to join JuiceFS discussions on GitHub and our community on Slack.